
Compare Maral Overseas with Similar Stocks
Dashboard
High Debt company with Weak Long Term Fundamental Strength
- Poor long term growth as Operating profit has grown by an annual rate -11.88% of over the last 5 years
- High Debt Company with a Debt to Equity ratio (avg) of 2.99 times
- The company has been able to generate a Return on Equity (avg) of 8.78% signifying low profitability per unit of shareholders funds
48.03% of Promoter Shares are Pledged
Underperformed the market in the last 1 year
Stock DNA
Garments & Apparels
INR 237 Cr (Micro Cap)
60.00
52
0.00%
3.30
3.45%
2.10
Total Returns (Price + Dividend) 
Latest dividend: 2 per share ex-dividend date: Aug-17-2022
Risk Adjusted Returns v/s
Returns Beta

News
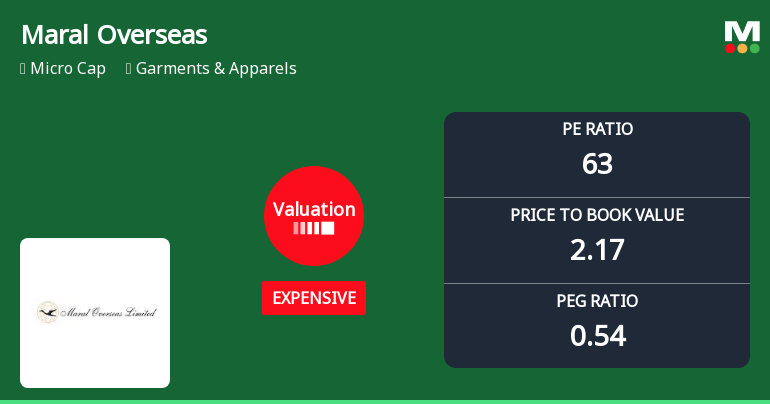
Maral Overseas Ltd Valuation Shifts Signal Price Attractiveness Concerns
Maral Overseas Ltd, a micro-cap player in the Garments & Apparels sector, has seen its valuation parameters shift notably, raising questions about its price attractiveness relative to historical and peer benchmarks. Despite a year-to-date stock return of 31.3%, the company’s elevated price-to-earnings (P/E) and price-to-book value (P/BV) ratios suggest a transition from fair to expensive territory, prompting a downgrade in its Mojo Grade to Sell from Strong Sell.
Read full news article
Maral Overseas Ltd is Rated Sell
Maral Overseas Ltd is rated 'Sell' by MarketsMOJO, with this rating last updated on 05 May 2026. However, the analysis and financial metrics discussed here reflect the company’s current position as of 02 June 2026, providing investors with an up-to-date view of its fundamentals, returns, and market standing.
Read full news article
Golden Cross Forms in Maral Overseas Ltd — On a Day the Stock Was Flat. What the Mixed Signals Mean
The 50-day moving average has crossed above the 200-day moving average for Maral Overseas Ltd, signalling a golden cross on 1 Jun 2026. Yet, the stock closed unchanged on the day, while several monthly technical indicators remain ambiguous or bearish. This juxtaposition invites a closer look at whether the golden cross is a reliable signal or a lone beacon amid mixed data.
Read full news article Announcements
Disclosure Under Regulation 30 Of SEBI LODR
09-Jun-2026 | Source : BSEDisclosure attached
Special Window For Re-Lodgment Of Transfer Requests Of Physical Shares
08-Jun-2026 | Source : BSEDisclosure attached
Announcement under Regulation 30 (LODR)-Newspaper Publication
08-May-2026 | Source : BSEExtract of Audited Financial Results for the quarter and year ended 31st March 2026 Special Window for Transfer and Dematerialisation of Physical Securities and updation of KYC by shareholders published in the newspaper Business Standard and Navbharat are attached.
Corporate Actions

No Upcoming Board Meetings

Maral Overseas Ltd has declared 20% dividend, ex-date: 17 Aug 22

No Splits history available

No Bonus history available

No Rights history available
Quality key factors
Valuation key factors
Technicals key factors
 Technical Indicator Scale: Bearish, Mildly Bearish, Sideways, Mildly Bullish, Bullish Turned
 Shareholding Snapshot : Mar 2026
Shareholding Compare (%holding)
Promoters
48.0336
Held by 5 Schemes (0.0%)
Held by 1 FIIs (0.06%)
Agarwal Trademart Private Limited (47.61%)
Ajay Upadhyaya (1.74%)
18.52%
Quarterly Results Snapshot (Standalone) - Mar'26 - QoQ

QoQ Growth in quarter ended Mar 2026 is 4.35% vs -0.90% in Dec 2025

QoQ Growth in quarter ended Mar 2026 is 151.13% vs 290.65% in Dec 2025
Half Yearly Results Snapshot (Standalone) - Sep'25
Growth in half year ended Sep 2025 is -8.96% vs 10.43% in Sep 2024
Growth in half year ended Sep 2025 is -14.55% vs 19.81% in Sep 2024
Nine Monthly Results Snapshot (Standalone) - Dec'25
YoY Growth in nine months ended Dec 2025 is -6.43% vs 10.29% in Dec 2024
YoY Growth in nine months ended Dec 2025 is 58.06% vs -53.10% in Dec 2024
Annual Results Snapshot (Standalone) - Mar'26
YoY Growth in year ended Mar 2026 is -6.32% vs 9.06% in Mar 2025
YoY Growth in year ended Mar 2026 is 113.47% vs -147.70% in Mar 2025
About Maral Overseas Ltd

Company Coordinates


