
Compare Marble City with Similar Stocks
Dashboard
Low ability to service debt as the company has a high Debt to EBITDA ratio of 4.77 times
- Low ability to service debt as the company has a high Debt to EBITDA ratio of 4.77 times
- The company has been able to generate a Return on Equity (avg) of 6.35% signifying low profitability per unit of shareholders funds
Flat results in Mar 26
Underperformed the market in the last 1 year
Total Returns (Price + Dividend) 
Marble City for the last several years.
Risk Adjusted Returns v/s
Returns Beta

News

Marble City India Ltd Upgraded to Sell on Mixed Financial and Technical Signals
Marble City India Ltd has seen its investment rating upgraded from Strong Sell to Sell as of 1 June 2026, reflecting a nuanced shift in its financial, quality, valuation, and technical parameters. Despite recent flat financial performance and a challenging market environment, the company’s improved valuation and quality grades have contributed to a more favourable outlook, although caution remains warranted given ongoing operational headwinds.
Read full news article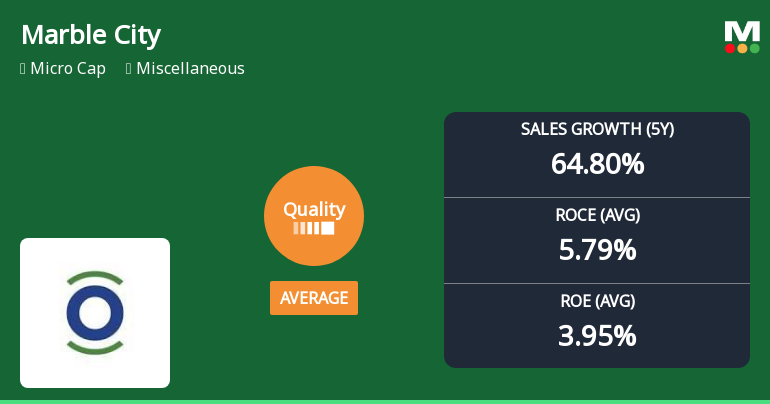
Marble City India Ltd Quality Grade Upgrade Signals Mixed Business Fundamentals
Marble City India Ltd has recently seen its quality grade improve from below average to average, reflecting notable changes in its business fundamentals. Despite a challenging market environment and a micro-cap status, the company’s financial metrics reveal a mixed picture of growth, leverage, and returns that investors should carefully consider.
Read full news articleAre Marble City India Ltd latest results good or bad?
Marble City India Ltd's latest financial results for Q4 FY26 present a complex picture characterized by significant revenue growth but substantial declines in profitability. The company reported net sales of ₹34.42 crores, reflecting a year-on-year increase of 35.73% and a notable sequential growth of 91.54% from the previous quarter. This achievement marks the highest quarterly sales on record for Marble City, indicating strong demand for its imported marble products. However, this revenue expansion did not translate into profitability, as the net profit fell sharply to ₹1.66 crores, representing a 63.60% decline compared to the same quarter last year. Although there was a sequential recovery of 69.39% from the previous quarter's profit of ₹0.98 crores, this recovery remains insufficient to offset the year-on-year decline. The company's profit after tax (PAT) margin contracted significantly to 7.06%, down...
Read full news article Announcements
Shareholder Meeting / Postal Ballot-Outcome of EGM
10-Jun-2026 | Source : BSEOutcome of Extra Ordinary General Meeting held on 10th June 2026.
Voting Results
10-Jun-2026 | Source : BSEVoting Results of Extra Ordinary General Meeting Held today i.e. 10.06.2026
Proceedings Of EGM Dated 10Th June 2026
10-Jun-2026 | Source : BSEProceedings of Extra Ordinary General Meeting held on 10th June 2026 via VC/OAVM.
Corporate Actions

No Upcoming Board Meetings

Marble City India Ltd has declared 5% dividend, ex-date: To Be Announced

Marble City India Ltd has announced 5:10 stock split, ex-date: 14 Oct 19

No Bonus history available

No Rights history available
Quality key factors
Valuation key factors
Technicals key factors
 Technical Indicator Scale: Bearish, Mildly Bearish, Sideways, Mildly Bullish, Bullish Turned
 Shareholding Snapshot : Mar 2026
Shareholding Compare (%holding)
Non Institution
None
Held by 2 Schemes (1.14%)
Held by 0 FIIs
Reven Distributors Private Limited (19.0%)
Psh Constructions Private Limited (15.23%)
16.84%
Quarterly Results Snapshot (Standalone) - Mar'26 - QoQ

QoQ Growth in quarter ended Mar 2026 is 50.03% vs -11.39% in Dec 2025

QoQ Growth in quarter ended Mar 2026 is -58.00% vs -26.47% in Dec 2025
Half Yearly Results Snapshot (Standalone) - Sep'25
Growth in half year ended Sep 2025 is 126.24% vs -50.90% in Sep 2024
Growth in half year ended Sep 2025 is 220.92% vs -1,186.36% in Sep 2024
Nine Monthly Results Snapshot (Standalone) - Dec'25
YoY Growth in nine months ended Dec 2025 is 61.93% vs -13.61% in Dec 2024
YoY Growth in nine months ended Dec 2025 is 278.44% vs -257.38% in Dec 2024
Annual Results Snapshot (Standalone) - Mar'26
YoY Growth in year ended Mar 2026 is 33.10% vs 28.57% in Mar 2025
YoY Growth in year ended Mar 2026 is 80.67% vs 222.05% in Mar 2025
About Marble City India Ltd

Company Coordinates


