
Compare Margo Finance with Similar Stocks
Stock DNA
Non Banking Financial Company (NBFC)
INR 29 Cr (Micro Cap)
27.00
20
0.00%
0.00
0.81%
0.22
Total Returns (Price + Dividend) 
Margo Finance for the last several years.
Risk Adjusted Returns v/s
Returns Beta

News
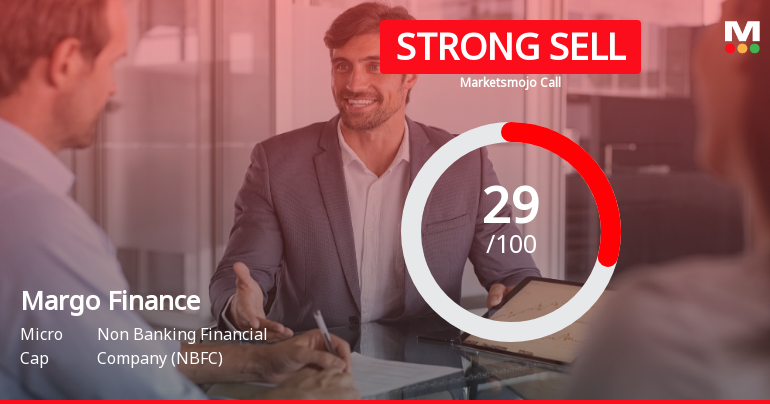
Margo Finance Ltd Downgraded to Strong Sell Amid Technical Weakness and Valuation Concerns
Margo Finance Ltd, a micro-cap player in the Non Banking Financial Company (NBFC) sector, has seen its investment rating downgraded from Sell to Strong Sell as of 8 June 2026. This adjustment reflects a confluence of deteriorating technical indicators, subdued financial trends, and weak fundamental quality, despite some positive quarterly earnings. Investors are advised to carefully consider these factors amid the stock’s underperformance relative to broader market benchmarks.
Read full news article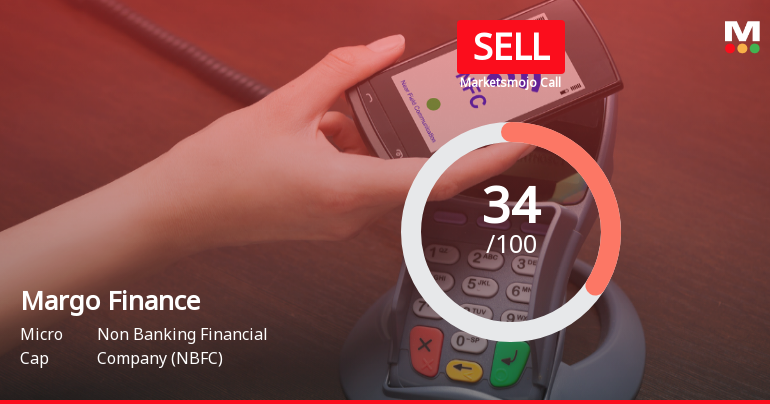
Margo Finance Ltd Downgraded to Sell Amid Mixed Financial and Valuation Signals
Margo Finance Ltd, a micro-cap player in the Non Banking Financial Company (NBFC) sector, has been assigned a Sell rating with a Mojo Score of 34.0, marking its first formal grade after previously being unclassified. This rating change, effective from 29 May 2026, reflects a nuanced assessment across four key parameters: quality, valuation, financial trend, and technicals. Despite recent positive quarterly financial results, the company’s long-term fundamentals and market performance present a complex picture for investors.
Read full news article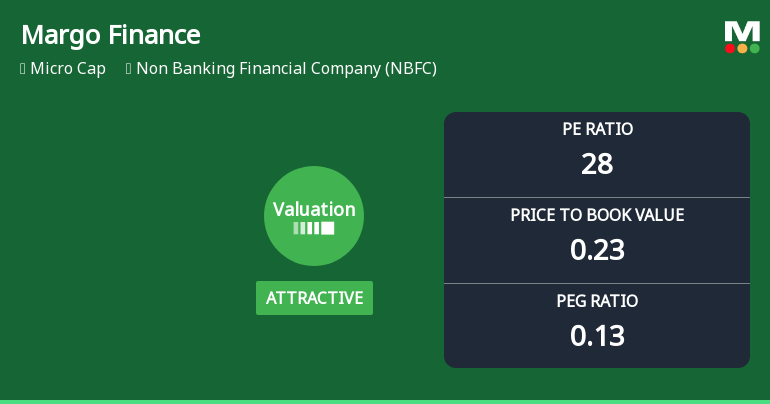
Margo Finance Ltd Valuation Shifts Signal Renewed Price Attractiveness
Margo Finance Ltd, a micro-cap player in the Non Banking Financial Company (NBFC) sector, has undergone a significant valuation recalibration, shifting from a previously very expensive rating to an attractive valuation grade. This change is underscored by a notable adjustment in key price multiples, including the price-to-earnings (P/E) and price-to-book value (P/BV) ratios, positioning the stock as a compelling consideration for investors seeking value within the NBFC space.
Read full news article Announcements
Compliances-Reg.24(A)-Annual Secretarial Compliance
27-May-2026 | Source : BSEThis is to inform that Annual Secretarial Compliance Report under Reg 24(A) of SEBI (LODR) Regulations 2015 is not applicable to the Company since the paid up equity share capital is not exceeding Rs. 10 Crores and net worth is not exceeding Rs. 25 crores on the last day of previous financial year.
Board Meeting Outcome for Outcome Of Board Meeting Held On 27Th May 2026
27-May-2026 | Source : BSEWe wish to inform you that at the Board Meeting held today i.e. on 27th May 2026 the Board of Directors of Margo Finance Limited (the Company) approved the Audited Standalone Financial Results of the Company for the quarter and year ended 31st March 2026. Pursuant to Regulation 30 and 33 of SEBI (Listing Obligations and Disclosure Requirements) 2015 (Listing Regulations) we are enclosing herewith the following: 1. Audited Standalone Financial Results of the Company for the quarter and year ended 31st March 2026 2. Independent Auditors Report on Audited Standalone Financial Results of the Company for the quarter and year ended 31st March 2026 issued by M/s. Pawan Shubham & Co. Statutory Auditors of the Company and 3. Declaration on Auditors Report with unmodified opinion pursuant to Regulation 33(3)(d) of the Listing Regulations signed by Mr. Shri Dass Maheshwari Chief Financial Officer of the Company.
Non-Applicability Of Disclosures Of Related Party Transactions For The Year Ended 31St March 2026
27-May-2026 | Source : BSEThis is to inform that Disclosure of Related Party Transactions is not applicable to the Company since the paid up equity share capital is not exceeding Rs. 10 crores and net worth is not exceeding Rs. 25 crores.
Corporate Actions

No Upcoming Board Meetings

No Dividend history available

No Splits history available

No Bonus history available

No Rights history available
Quality key factors
Valuation key factors
Technicals key factors
 Technical Indicator Scale: Bearish, Mildly Bearish, Sideways, Mildly Bullish, Bullish Turned
 Shareholding Snapshot : Mar 2026
Shareholding Compare (%holding)
Promoters
None
Held by 0 Schemes
Held by 0 FIIs
Rini Investment And Finance Private Limited (9.96%)
Sujit Krishna Puthran (1.47%)
43.23%
Quarterly Results Snapshot (Standalone) - Mar'26 - QoQ

QoQ Growth in quarter ended Mar 2026 is 245.16% vs -29.55% in Dec 2025
QoQ Growth in quarter ended Mar 2026 is 1,083.33% vs -78.57% in Dec 2025
Half Yearly Results Snapshot (Standalone) - Sep'25

Growth in half year ended Sep 2025 is -47.22% vs 89.47% in Sep 2024
Growth in half year ended Sep 2025 is -48.33% vs 130.77% in Sep 2024
Nine Monthly Results Snapshot (Standalone) - Dec'25
YoY Growth in nine months ended Dec 2025 is -29.03% vs 90.77% in Dec 2024
YoY Growth in nine months ended Dec 2025 is -32.73% vs 161.90% in Dec 2024
Annual Results Snapshot (Standalone) - Mar'26
YoY Growth in year ended Mar 2026 is 45.19% vs 66.67% in Mar 2025
YoY Growth in year ended Mar 2026 is 205.71% vs 45.83% in Mar 2025
About Margo Finance Ltd

Company Coordinates


