
Compare Maris Spinners with Similar Stocks
Dashboard
High Debt company with Weak Long Term Fundamental Strength
- Poor long term growth as Operating profit has grown by an annual rate -59.28% of over the last 5 years
- High Debt Company with a Debt to Equity ratio (avg) of 2.84 times
- The company has been able to generate a Return on Equity (avg) of 7.25% signifying low profitability per unit of shareholders funds
Flat results in Mar 26
Consistent Underperformance against the benchmark over the last 3 years
Stock DNA
Garments & Apparels
INR 25 Cr (Micro Cap)
NA (Loss Making)
23
0.00%
3.44
-7.98%
1.35
Total Returns (Price + Dividend) 
Latest dividend: 1 per share ex-dividend date: Sep-13-2022
Risk Adjusted Returns v/s
Returns Beta

News
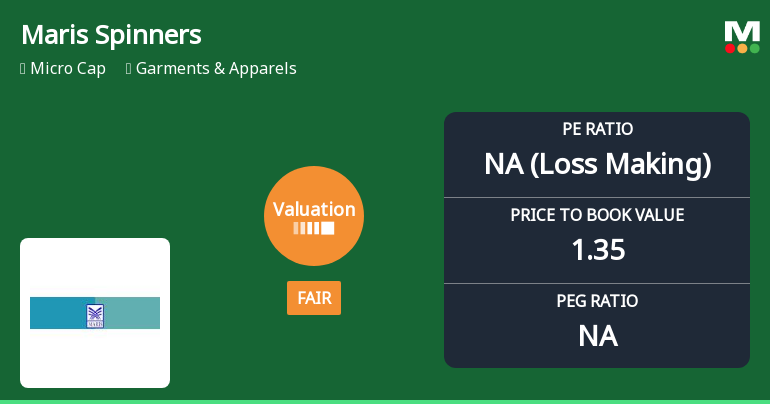
Maris Spinners Ltd Valuation Shifts Signal Caution for Investors
Maris Spinners Ltd, a micro-cap player in the Garments & Apparels sector, has witnessed a notable shift in its valuation parameters, moving from an attractive to a fair rating. Despite a recent uptick in share price, the company’s financial metrics and peer comparisons reveal a complex picture for investors assessing its price attractiveness.
Read full news article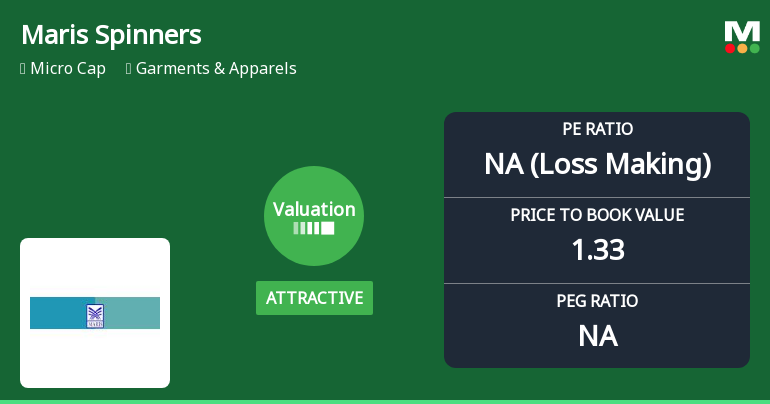
Maris Spinners Ltd Valuation Shifts Signal Renewed Price Attractiveness
Maris Spinners Ltd, a micro-cap player in the Garments & Apparels sector, has witnessed a notable shift in its valuation parameters, moving from a risky to an attractive price territory. Despite ongoing sector headwinds and a challenging market environment, the company’s price-to-earnings (P/E) and price-to-book value (P/BV) ratios now present a compelling case for value-oriented investors, even as operational metrics remain subdued.
Read full news articleAre Maris Spinners Ltd latest results good or bad?
Maris Spinners Ltd's latest financial results for Q4 FY26 present a complex picture of its operational performance. The company reported net sales of ₹45.91 crores, reflecting an 11.32% sequential growth from ₹41.24 crores in the previous quarter. This growth, however, is tempered by a modest year-on-year increase of only 2.18%. The net profit for the quarter stood at ₹0.33 crores, a notable recovery from a loss of ₹0.83 crores in the prior quarter, indicating a return to nominal profitability. The operating margin improved to 5.45%, up from 2.35% in Q3 FY26, marking the highest margin in recent quarters, yet it remains below industry standards. This improvement is overshadowed by concerns regarding the company's reliance on other income, which constituted a significant portion of profit before tax, highlighting underlying weaknesses in its core operations. Despite the sequential gains, the company's bala...
Read full news article Announcements
Announcement under Regulation 30 (LODR)-Newspaper Publication
03-Jun-2026 | Source : BSENews paper publication of audited financial results for the quarter/year ended 31.03.2026
Board Meeting Intimation for To Consider And Approve Audited Financial Results And Reappointment Of Managing Director For A Period Of 3 Years From 23-09-2026 To 22-09-2029 And Fixing The Date Of Annual General Meeting
02-May-2026 | Source : BSEMaris Spinners Ltd-has informed BSE that the meeting of the Board of Directors of the Company is scheduled on 28/05/2026 inter alia to consider and approve Board meeting on 28-05-2026 with the following agenda 1. to approve audited financial results 2. to approve the date of the 47th Annual General meeting 3. To fix the record date / Book closure date 4. To approve the Notice of Annual General Meeting 5. To approve the related party transactions for the half year ended 31st March 2026 6. To reappoint Mr. T Raghuraman Managing Director for a period of 3 years from 23-09-2026 to 22-09-2029 7. Any other subject with the approval of the Chairman
Disclosure Received From The Promoter Under Regulation 7(2) Of SEBI Prohibition Of Insider Trading Regulations 2015 Regarding Disposal And Acquisition Of Shares
10-Apr-2026 | Source : BSECompany received disclosure from a promoter under Reg 7 (2) of SEBI Prohibition of Insider trading Regulations 2015 that he transferred his shares from his HUF category to self individual category and continues to be promoter .
Corporate Actions

No Upcoming Board Meetings

Maris Spinners Ltd has declared 10% dividend, ex-date: 13 Sep 22

No Splits history available

No Bonus history available

No Rights history available
Quality key factors
Valuation key factors
Technicals key factors
 Technical Indicator Scale: Bearish, Mildly Bearish, Sideways, Mildly Bullish, Bullish Turned
 Shareholding Snapshot : Mar 2026
Shareholding Compare (%holding)
Promoters
None
Held by 0 Schemes
Held by 0 FIIs
Harigovind Ananthakumar (20.72%)
Rajesh Nathmal Kabra (2.04%)
23.24%
Quarterly Results Snapshot (Standalone) - Mar'26 - QoQ

QoQ Growth in quarter ended Mar 2026 is 11.32% vs -4.36% in Dec 2025
QoQ Growth in quarter ended Mar 2026 is 139.76% vs -59.62% in Dec 2025
Half Yearly Results Snapshot (Standalone) - Sep'25
Growth in half year ended Sep 2025 is -0.68% vs -2.69% in Sep 2024

Growth in half year ended Sep 2025 is 44.32% vs 71.10% in Sep 2024
Nine Monthly Results Snapshot (Standalone) - Dec'25
YoY Growth in nine months ended Dec 2025 is -1.31% vs 0.96% in Dec 2024
YoY Growth in nine months ended Dec 2025 is 29.57% vs 71.25% in Dec 2024
Annual Results Snapshot (Standalone) - Mar'26
YoY Growth in year ended Mar 2026 is -0.39% vs 5.22% in Mar 2025
YoY Growth in year ended Mar 2026 is -16.67% vs 86.20% in Mar 2025
About Maris Spinners Ltd

Company Coordinates


