
Compare Marksans Pharma with Similar Stocks
Stock DNA
Pharmaceuticals & Biotechnology
INR 12,340 Cr (Small Cap)
29.00
35
0.30%
-0.21
13.82%
3.99
Total Returns (Price + Dividend) 
Latest dividend: 0.7934643409141091 per share ex-dividend date: Aug-01-2025
Risk Adjusted Returns v/s
Returns Beta

News
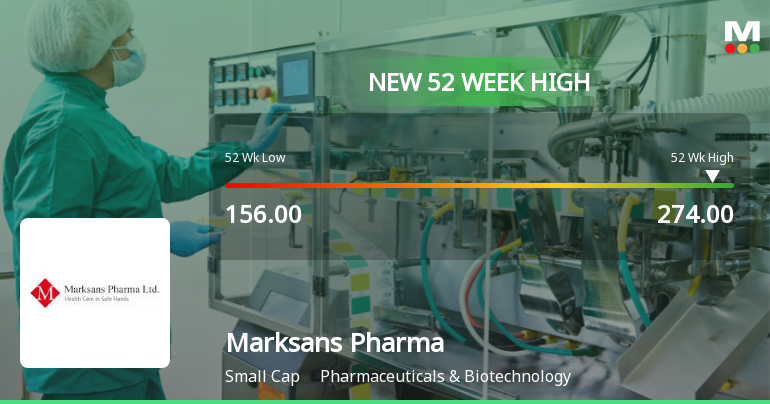
Broad-Based Technical Strength Lifts Marksans Pharma Ltd to 52-Week High of Rs 275
With a decisive surge to Rs 275 on 24 Jun 2026, Marksans Pharma Ltd has reached a fresh 52-week high, extending its recent momentum amid a broadly supportive market backdrop.
Read full news article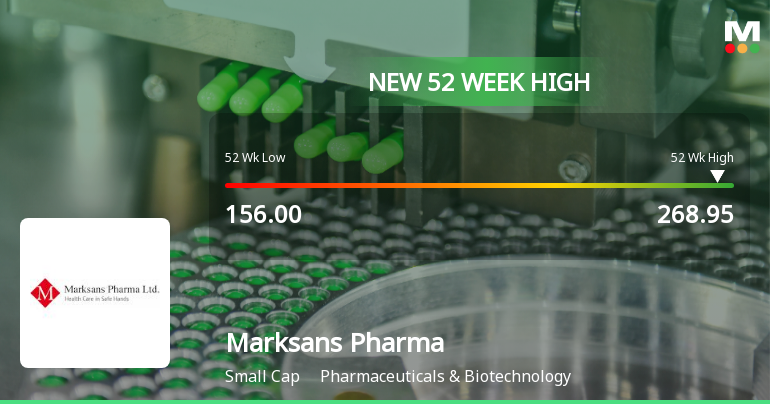
Broad-Based Technical Strength Lifts Marksans Pharma Ltd to 52-Week High of Rs 268.95
With a decisive surge to Rs 268.95 on 23 Jun 2026, Marksans Pharma Ltd has reached a fresh 52-week high, extending its year-long rally that has outpaced the broader market by over 16 percentage points.
Read full news article
Marksans Pharma Ltd is Rated Buy by MarketsMOJO
Marksans Pharma Ltd is rated 'Buy' by MarketsMOJO, with this rating last updated on 08 June 2026. However, the analysis and financial metrics discussed here reflect the company’s current position as of 20 June 2026, providing investors with the most up-to-date insight into the stock’s fundamentals, returns, and overall outlook.
Read full news article Announcements
DISCLOSURE REGARDING SECOND 100 DAY CAMPAIGN - SAKSHAM NIVESHAK
23-Jun-2026 | Source : BSECampaign for KYC and other related updations and shareholders engagement to prevent transfer of unclaimed dividend to IEPF
Announcement Under Regulation 30 (LODR)- Updates
16-Jun-2026 | Source : BSEUpdate on acquisition of QliniQ B.V.
Announcement under Regulation 30 (LODR)-Credit Rating
09-Jun-2026 | Source : BSEIndia Ratings and Research has revised the outlook for the Companys bank loan facilities to Positive from Stable
Corporate Actions

No Upcoming Board Meetings

Marksans Pharma Ltd has declared 80% dividend, ex-date: 01 Aug 25

Marksans Pharma Ltd has announced 1:10 stock split, ex-date: 11 Mar 08

No Bonus history available

No Rights history available
Quality key factors
Valuation key factors
Technicals key factors
 Technical Indicator Scale: Bearish, Mildly Bearish, Sideways, Mildly Bullish, Bullish Turned
 Shareholding Snapshot : Mar 2026
Shareholding Compare (%holding)
Promoters
None
Held by 9 Schemes (4.66%)
Held by 118 FIIs (16.76%)
Mark Saldanha (43.8%)
Orbimed Asia Iv Mauritius Fvci Limited (8.62%)
28.33%
Quarterly Results Snapshot (Consolidated) - Mar'26 - QoQ

QoQ Growth in quarter ended Mar 2026 is 13.48% vs 4.72% in Dec 2025
QoQ Growth in quarter ended Mar 2026 is 30.86% vs 15.22% in Dec 2025
Half Yearly Results Snapshot (Consolidated) - Sep'25

Growth in half year ended Sep 2025 is 8.75% vs 19.52% in Sep 2024
Growth in half year ended Sep 2025 is -15.58% vs 21.88% in Sep 2024
Nine Monthly Results Snapshot (Consolidated) - Dec'25
YoY Growth in nine months ended Dec 2025 is 9.43% vs 18.36% in Dec 2024
YoY Growth in nine months ended Dec 2025 is -6.99% vs 23.20% in Dec 2024
Annual Results Snapshot (Consolidated) - Mar'26
YoY Growth in year ended Mar 2026 is 12.51% vs 20.46% in Mar 2025
YoY Growth in year ended Mar 2026 is 9.81% vs 21.32% in Mar 2025
About Marksans Pharma Ltd

Company Coordinates


