
Compare MasterBrand, Inc. with Similar Stocks
Total Returns (Price + Dividend) 
MasterBrand, Inc. for the last several years.
Risk Adjusted Returns v/s
News
Is MasterBrand, Inc. overvalued or undervalued?
As of 21 November 2025, the valuation grade for MasterBrand, Inc. has moved from very expensive to fair. The company appears to be fairly valued based on its current metrics. Key ratios include a P/E ratio of 11, a Price to Book Value of 1.01, and an EV to EBITDA of 7.03. In comparison, HNI Corp. has a P/E of 13.40, while Leggett & Platt, Inc. shows a more attractive P/E of 12.32, indicating that MasterBrand is positioned competitively within its industry. Despite its fair valuation, MasterBrand has experienced significant negative returns, with a year-to-date decline of 30.53% compared to a 12.26% gain in the S&P 500, reflecting underperformance in the broader market context....
Read full news article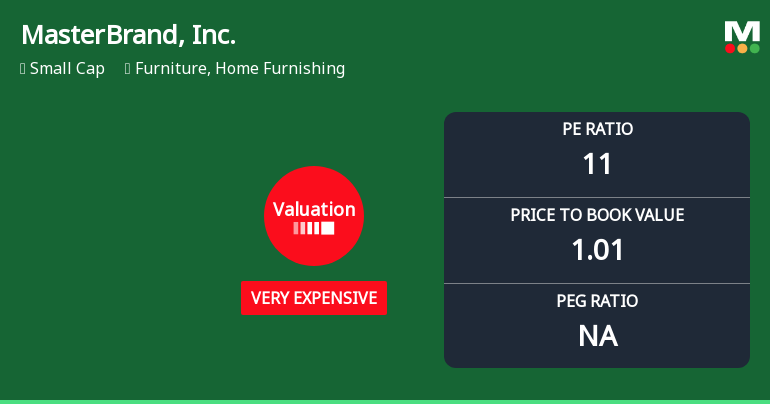
MasterBrand, Inc. Experiences Revision in Its Stock Evaluation Amid Market Challenges
MasterBrand, Inc., a small-cap furniture company, has recently adjusted its valuation, with its stock price at $12.63. Over the past year, it has experienced a significant decline, contrasting with the S&P 500's performance. Key financial metrics reveal insights into its operational efficiency and competitive positioning within the industry.
Read full news article Announcements

Corporate Actions
Quality key factors
Valuation key factors
Technicals key factors
 Technical Indicator Scale: Bearish, Mildly Bearish, Sideways, Mildly Bullish, Bullish Turned
 Shareholding Snapshot : Mar 2025
Shareholding Compare (%holding)
Domestic Funds
Held in 77 Schemes (53.88%)
Held by 143 Foreign Institutions (10.81%)
Quarterly Results Snapshot (Consolidated) - Jun'25 - YoY

YoY Growth in quarter ended Jun 2025 is 8.04% vs -2.68% in Jun 2024

YoY Growth in quarter ended Jun 2025 is -17.66% vs -11.52% in Jun 2024
Annual Results Snapshot (Consolidated) - Dec'24
YoY Growth in year ended Dec 2024 is -0.95% vs -16.77% in Dec 2023
YoY Growth in year ended Dec 2024 is -30.82% vs 17.12% in Dec 2023
About MasterBrand, Inc.

Company Coordinates


