
Compare Mauria Udyog with Similar Stocks
Dashboard
High Debt Company with a Debt to Equity ratio (avg) of 3.86 times
- Poor long term growth as Net Sales has grown by an annual rate of 12.49% over the last 5 years
- High Debt Company with a Debt to Equity ratio (avg) of 3.86 times
Negative results in Mar 26
Underperformed the market in the last 1 year
Stock DNA
Other Industrial Products
INR 122 Cr (Micro Cap)
5.00
44
0.00%
2.04
42.70%
2.16
Total Returns (Price + Dividend) 
Latest dividend: 0.2 per share ex-dividend date: Oct-09-2018
Risk Adjusted Returns v/s
Returns Beta

News

Mauria Udyog Ltd is Rated Sell
Mauria Udyog Ltd is rated 'Sell' by MarketsMOJO, with this rating last updated on 14 February 2026. However, the analysis and financial metrics discussed here reflect the stock's current position as of 01 June 2026, providing investors with an up-to-date view of its performance and outlook.
Read full news article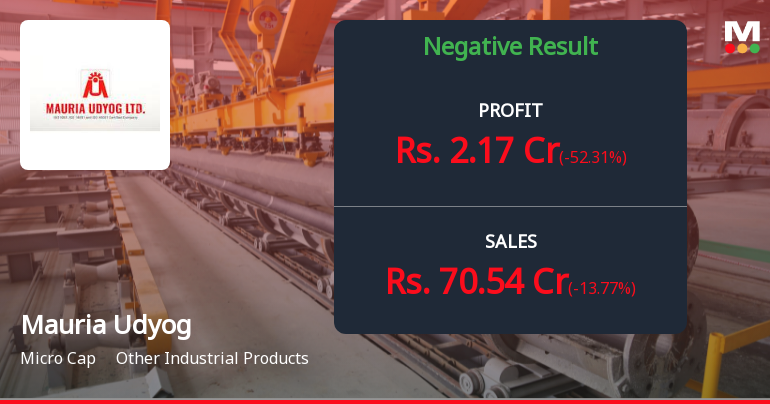
Mauria Udyog Q4 FY26: Sharp Profit Decline Amid Revenue Contraction Raises Concerns
Mauria Udyog Ltd., a micro-cap manufacturer of LPG cylinders, valves, regulators, and terry towels, reported a concerning performance for Q4 FY26, with net profit plunging 50.46% year-on-year to ₹2.17 crores and revenue contracting 27.29% to ₹70.54 crores. The quarter marked a sharp sequential deterioration as well, with profit down 52.31% from the previous quarter's ₹4.55 crores, raising red flags about operational sustainability.
Read full news article
Mauria Udyog Ltd is Rated Sell
Mauria Udyog Ltd is rated 'Sell' by MarketsMOJO, with this rating last updated on 14 Feb 2026. However, the analysis and financial metrics discussed here reflect the stock's current position as of 21 May 2026, providing investors with an up-to-date view of the company’s fundamentals, returns, and market performance.
Read full news article Announcements
Announcement under Regulation 30 (LODR)-Newspaper Publication
01-Jun-2026 | Source : BSENewspaper Cutting of Audited Financial Results-31.03.2026 pursuant to Reg 47c of LODR
Audited Financial Results-31.03.2026
29-May-2026 | Source : BSEAudited Financial Results-31.03.2026
Board Meeting Intimation for Approving & Taking On Record The Audited Financial Results For The Quarter And FY Ended 31-03-2026;
19-May-2026 | Source : BSEMauria Udyog Ltdhas informed BSE that the meeting of the Board of Directors of the Company is scheduled on 29/05/2026 inter alia to consider and approve A meeting of the Board of Directors of the Company is scheduled on Friday May 29 2026 at 03:00 PM onwards to approve & take on record the Audited Financial Results for the Quarter and FY ended 31-03-2026; Financial statements comprising of Balance-Sheet Profit & Loss statements and Cash-flow statements at 31-03-2026 ; and to take on record the Audit Report on the aforesaid Financial Results.
Corporate Actions

No Upcoming Board Meetings

Mauria Udyog Ltd has declared 2% dividend, ex-date: 09 Oct 18

Mauria Udyog Ltd has announced 1:10 stock split, ex-date: 10 Mar 22

No Bonus history available

No Rights history available
Quality key factors
Valuation key factors
Technicals key factors
 Technical Indicator Scale: Bearish, Mildly Bearish, Sideways, Mildly Bullish, Bullish Turned
 Shareholding Snapshot : Mar 2026
Shareholding Compare (%holding)
Promoters
None
Held by 0 Schemes
Held by 0 FIIs
Navneet Kumar Sureka (16.63%)
Sbj Bpo Services Limited (1.41%)
22.7%
Quarterly Results Snapshot (Consolidated) - Mar'26 - QoQ

QoQ Growth in quarter ended Mar 2026 is -13.77% vs -40.69% in Dec 2025
QoQ Growth in quarter ended Mar 2026 is -52.31% vs -57.08% in Dec 2025
Half Yearly Results Snapshot (Consolidated) - Sep'25
Growth in half year ended Sep 2025 is 49.18% vs 13.08% in Sep 2024
Growth in half year ended Sep 2025 is 98.73% vs -10.33% in Sep 2024
Nine Monthly Results Snapshot (Consolidated) - Dec'25

YoY Growth in nine months ended Dec 2025 is 13.41% vs 27.11% in Dec 2024
YoY Growth in nine months ended Dec 2025 is 57.74% vs 4.22% in Dec 2024
Annual Results Snapshot (Consolidated) - Mar'26
YoY Growth in year ended Mar 2026 is 3.75% vs 21.97% in Mar 2025
YoY Growth in year ended Mar 2026 is 31.65% vs 8.72% in Mar 2025
About Mauria Udyog Ltd

Company Coordinates


