
Compare Maximus Interna. with Similar Stocks
Dashboard
Negative results in Mar 26
- ROCE(HY) Lowest at 11.90%
- DEBTORS TURNOVER RATIO(HY) Lowest at 1.52 times
- OPERATING PROFIT TO INTEREST (Q) Lowest at 2.87 times
With ROCE of 9.5, it has a Attractive valuation with a 1.8 Enterprise value to Capital Employed
Majority shareholders : Promoters
Market Beating Performance
Stock DNA
Trading & Distributors
INR 184 Cr (Micro Cap)
20.00
23
0.00%
0.36
10.64%
2.11
Total Returns (Price + Dividend) 
Maximus Interna. for the last several years.
Risk Adjusted Returns v/s
Returns Beta

News

Broad-Based Technical Strength Lifts Maximus International Ltd to 52-Week High of Rs 13.66
With a steady climb from its 52-week low of Rs 8 to a fresh peak of Rs 13.66 on 15 Jul 2026, Maximus International Ltd has delivered a 17.33% return over the past year, comfortably outpacing the Sensex’s decline of 6.06%. This milestone caps an 11-day winning streak, underscoring the stock’s robust momentum despite a minor pullback on the day of the new high.
Read full news article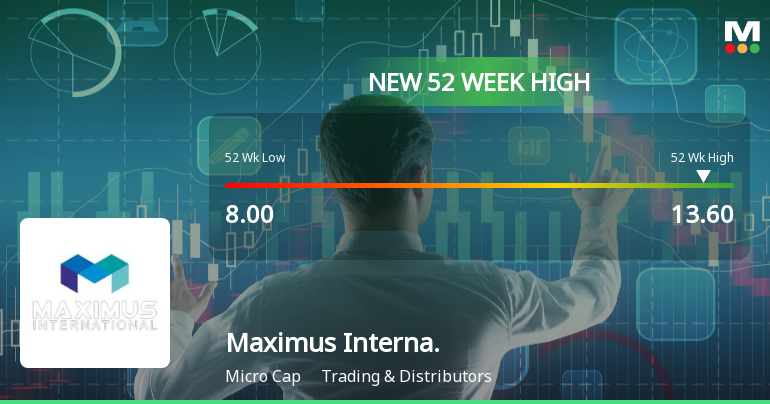
Broad-Based Technical Strength Lifts Maximus International Ltd to 52-Week High of Rs 13.6
Surpassing its previous peak, Maximus International Ltd touched a fresh 52-week high of Rs 13.6 on 14 Jul 2026, marking a notable 70% rise from its 52-week low of Rs 8. This milestone comes amid a backdrop of strong technical momentum, even as the broader market trades cautiously.
Read full news article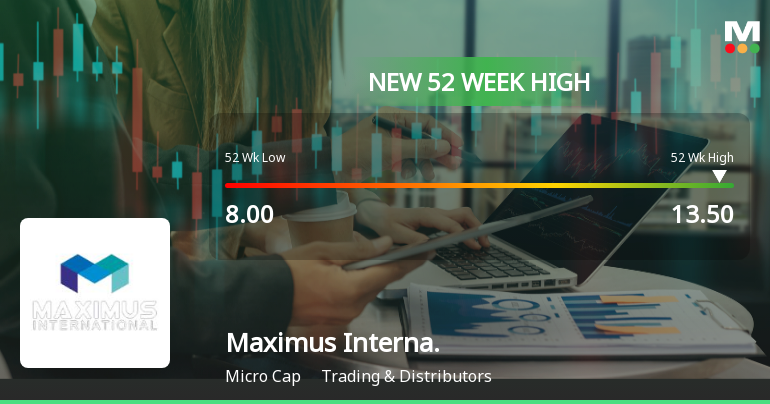
Broad-Based Technical Strength Lifts Maximus International Ltd to 52-Week High of Rs 13.5
From a 52-week low of Rs 8 to a fresh high of Rs 13.5, Maximus International Ltd has delivered an 18.6% return over the past year, significantly outperforming the Sensex which declined 6.8% in the same period. This milestone caps a nine-day winning streak that has propelled the stock above all key moving averages, signalling robust price momentum.
Read full news article Announcements
Compliances-Certificate under Reg. 74 (5) of SEBI (DP) Regulations 2018
11-Jul-2026 | Source : BSESubmission of Non-Applicability of Regulation 74(5) of SEBI (Depositories and Participants) Regulation 2018 for the quarter ended on 30 June 2026
Board Meeting Outcome for Outcome Of Board Meeting Held Today I.E. On Wednesday 8Th July 2026
08-Jul-2026 | Source : BSEOutcome of Board Meeting held today i.e. on Wednesday 8th July 2026
Disclosure Under Regulation 30 Of The SEBI (Listing Obligations And Disclosure Requirements) Regulations 2015
08-Jul-2026 | Source : BSEDisclosure Under Regulation 30 of the SEBI (Listing Obligations And Disclosure Requirements) Regulations 2015.
Corporate Actions

No Upcoming Board Meetings

No Dividend history available

Maximus International Ltd has announced 1:10 stock split, ex-date: 03 Oct 22

Maximus International Ltd has announced 1:1 bonus issue, ex-date: 26 Feb 19

No Rights history available
Quality key factors
Valuation key factors
Technicals key factors
 Technical Indicator Scale: Bearish, Mildly Bearish, Sideways, Mildly Bullish, Bullish Turned
 Shareholding Snapshot : Mar 2026
Shareholding Compare (%holding)
Promoters
None
Held by 0 Schemes
Held by 0 FIIs
Optimus Finance Limited (57.58%)
Emrald Commercial Limited (3.73%)
23.04%
Quarterly Results Snapshot (Standalone) - Mar'26 - YoY

YoY Growth in quarter ended Mar 2026 is -79.65% vs -43.05% in Mar 2025

YoY Growth in quarter ended Mar 2026 is 1,600.00% vs -42.86% in Mar 2025
Half Yearly Results Snapshot (Consolidated) - Sep'25
Growth in half year ended Sep 2025 is 13.72% vs 63.10% in Sep 2024
Growth in half year ended Sep 2025 is 20.28% vs 63.08% in Sep 2024
Nine Monthly Results Snapshot (Consolidated) - Dec'25
YoY Growth in nine months ended Dec 2025 is 15.04% vs 55.80% in Dec 2024
YoY Growth in nine months ended Dec 2025 is 0.57% vs 35.78% in Dec 2024
Annual Results Snapshot (Standalone) - Mar'26
YoY Growth in year ended Mar 2026 is 1.73% vs -36.43% in Mar 2025
YoY Growth in year ended Mar 2026 is 489.29% vs 600.00% in Mar 2025
About Maximus International Ltd

Company Coordinates


