
Compare Maximus Interna. with Similar Stocks
Stock DNA
Trading & Distributors
INR 147 Cr (Micro Cap)
16.00
21
0.00%
0.36
10.64%
1.68
Total Returns (Price + Dividend) 
Maximus Interna. for the last several years.
Risk Adjusted Returns v/s
Returns Beta

News
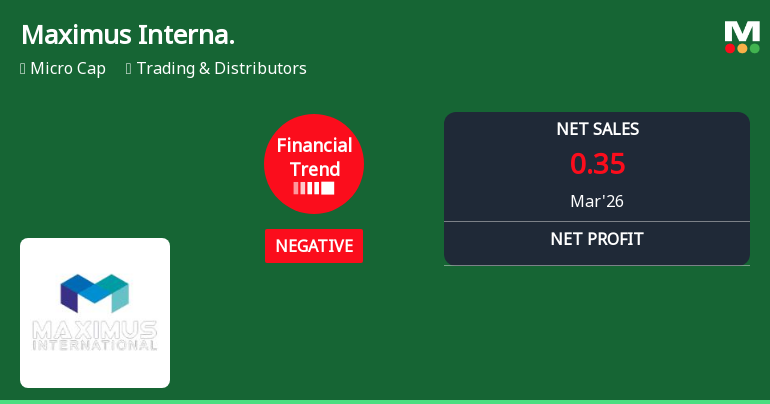
Maximus International Ltd Reports Declining Financial Trend Amid Highest Quarterly Sales
Maximus International Ltd, a micro-cap player in the Trading & Distributors sector, has reported its March 2026 quarter results reflecting a mixed bag of performance indicators. While the company achieved its highest quarterly net sales at ₹56.00 crores, several key financial metrics deteriorated, signalling a shift from a previously flat to a negative financial trend.
Read full news article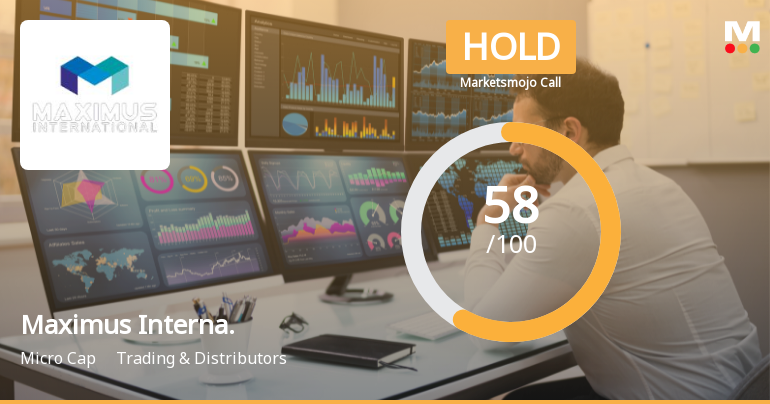
Maximus International Ltd Upgraded to Hold on Technical and Valuation Improvements
Maximus International Ltd, a micro-cap player in the Trading & Distributors sector, has seen its investment rating upgraded from Sell to Hold as of 25 May 2026. This change reflects a nuanced improvement across technical indicators, valuation metrics, and financial trends, despite ongoing challenges in long-term growth and profitability. The company’s Mojo Score now stands at 58.0, signalling a cautious but more optimistic outlook for investors.
Read full news article Announcements
Announcement under Regulation 30 (LODR)-Newspaper Publication
05-Jun-2026 | Source : BSESubmission of publication of advertisement regarding Notice of Postal Ballot and E-Voting information in newspapers.
Shareholder Meeting / Postal Ballot-Notice of Postal Ballot
04-Jun-2026 | Source : BSENotice of Postal Ballot.
Announcement under Regulation 30 (LODR)-Press Release / Media Release
03-Jun-2026 | Source : BSEPress Release dated 3rd June 2026.
Corporate Actions

No Upcoming Board Meetings

No Dividend history available

Maximus International Ltd has announced 1:10 stock split, ex-date: 03 Oct 22

Maximus International Ltd has announced 1:1 bonus issue, ex-date: 26 Feb 19

No Rights history available
Quality key factors
Valuation key factors
Technicals key factors
 Technical Indicator Scale: Bearish, Mildly Bearish, Sideways, Mildly Bullish, Bullish Turned
 Shareholding Snapshot : Mar 2026
Shareholding Compare (%holding)
Promoters
None
Held by 0 Schemes
Held by 0 FIIs
Optimus Finance Limited (57.58%)
Emrald Commercial Limited (3.73%)
23.04%
Quarterly Results Snapshot (Standalone) - Mar'26 - YoY

YoY Growth in quarter ended Mar 2026 is -79.65% vs -43.05% in Mar 2025

YoY Growth in quarter ended Mar 2026 is 1,600.00% vs -42.86% in Mar 2025
Half Yearly Results Snapshot (Consolidated) - Sep'25
Growth in half year ended Sep 2025 is 13.72% vs 63.10% in Sep 2024
Growth in half year ended Sep 2025 is 20.28% vs 63.08% in Sep 2024
Nine Monthly Results Snapshot (Consolidated) - Dec'25
YoY Growth in nine months ended Dec 2025 is 15.04% vs 55.80% in Dec 2024
YoY Growth in nine months ended Dec 2025 is 0.57% vs 35.78% in Dec 2024
Annual Results Snapshot (Standalone) - Mar'26
YoY Growth in year ended Mar 2026 is 1.73% vs -36.43% in Mar 2025
YoY Growth in year ended Mar 2026 is 489.29% vs 600.00% in Mar 2025
About Maximus International Ltd

Company Coordinates


