Mayank Cattle Fo

  • Market Cap: Micro Cap
  • Industry: FMCG
  • ISIN: INE0R5Z01015
  • NSEID:
  • BSEID: 544106
INR
252.00
3.3 (1.33%)
BSENSE

Aug 21, 12:09 PM

BSE+NSE Vol: 9000

  • Price Points
  • Score
  • Mojo Parameters
  • Total Return
  • News and Corporate Actions
  • Key factors
  • Shareholding
  • Financials
  • CompanyCV
stock-summaryPrice Point
High/Low

1Day

52 Week

Valuation
Technical
Day's Volume

CASH

9.0 k (108.33%) Volume

Shareholding (Mar 2026)

FII

0.00%

Held by 0 FIIs

DII

0.00%

Held by 0 DIIs

Promoter

65.00%

Why is Mayank Cattle Food Ltd falling/rising?

21-Aug-2026

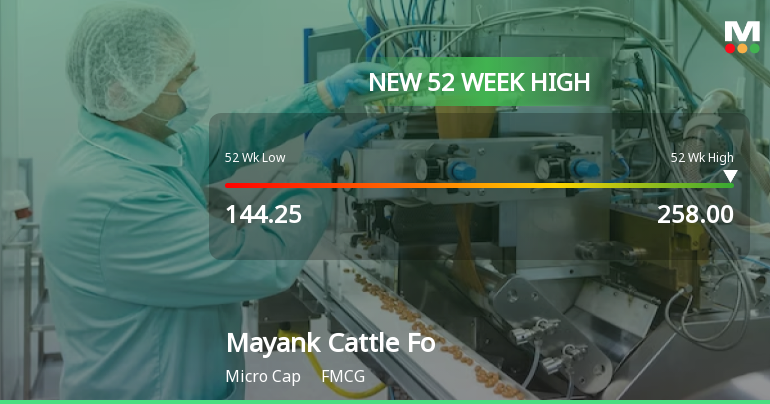
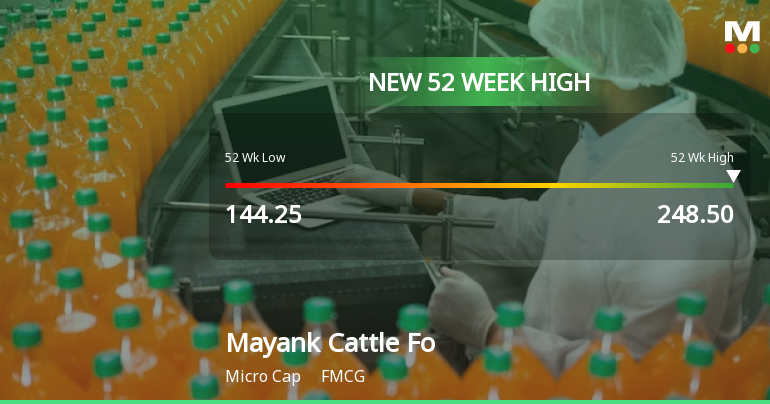
As of 20-Aug, Mayank Cattle Food Ltd's stock price is at 248.70, reflecting a 3.95% increase. The stock has shown strong performance with significant gains over various periods, reaching a new 52-week high and trading above key moving averages, indicating a robust upward trend.

As of 20-Aug, Mayank Cattle Food Ltd's stock price is rising, currently at 248.70, reflecting a change of 9.45 or 3.95% increase. The stock has demonstrated strong performance over various periods, with a 7.90% increase over the past week and a significant 17.04% rise over the past month. Year-to-date, the stock has surged by 47.20%, contrasting sharply with a decline of 9.02% in the Sensex during the same timeframe.<BR><BR>Today, the stock reached a new 52-week high of Rs.249.9, indicating positive momentum. It has outperformed its sector by 3.72% today and has been on a consecutive gain streak for the last three days, accumulating an 8.17% return in that period. The stock opened with a gap up of 3.72% today and touched an intraday high of Rs.249.9, which is a 4.45% increase.<BR><BR>Additionally, Mayank Cattle Food Ltd is trading above its 5-day, 20-day, 50-day, 100-day, and 200-day moving averages, suggesting a strong upward trend. There has also been a notable increase in investor participation, with delivery volume rising by 40% against the 5-day average. The liquidity of the stock is adequate, allowing for trades without significant barriers. All these factors contribute to the stock's rising price.

View full answer

What does Mayank Cattle Fo do?

14-Aug-2026

Mayank Cattle Food Ltd is a micro-cap company in the FMCG sector, recently converted to a public limited company in June 2023. It currently has no available sales or profit data, with a market cap of INR 122 Cr and a P/E ratio of 21.00.

Overview: <BR>Mayank Cattle Food Ltd operates in the FMCG industry and is categorized as a micro-cap company.<BR><BR>History: <BR>The company was originally incorporated as "Mayank Cattle Food Private Limited" in 1998. It later converted to a public limited company and changed its name to "Mayank Cattle Food Limited" on June 23, 2023. There is no sales or profit data available for the latest quarter.<BR><BR>Financial Snapshot: <BR>Most recent Net Sales: N/A <BR>Most recent Net Profit: N/A <BR>Market-cap value: INR 122 Cr (Micro Cap)<BR><BR>Key Metrics: <BR>P/E: 21.00 <BR>Industry P/E: 45 <BR>Dividend Yield: 0.00% <BR>Debt-Equity: 1.04 <BR>Return on Equity: 15.81% <BR>Price-to-Book: 3.19<BR><BR>Contact Details: <BR>Registrar Address: Not available. <BR>Phone: N/A <BR>Email: N/A <BR>Website: N/A

View full answer

Who are the peers of the Mayank Cattle Fo?

14-Aug-2026

Peers of Mayank Cattle Fo include Zeal Aqua, Choksi Asia, Tirupati Starch, Bengal Tea & Fab, B & A, Ganges Securitie, Narmada Agrobase, Aayush Wellness, and Jeyyam Global. Management risk varies from excellent at Ganges Securitie to below average at Zeal Aqua, with Choksi Asia showing the highest 1-year return at 110.20%.

Peers: The peers of Mayank Cattle Fo are Zeal Aqua, Choksi Asia, Tirupati Starch, Bengal Tea & Fab, B & A, Ganges Securitie, Narmada Agrobase, Aayush Wellness, and Jeyyam Global.<BR><BR>Quality Snapshot: Excellent management risk is observed at Ganges Securitie, while Good management risk is found at Aayush Wellness. Average management risk is present at Choksi Asia, Tirupati Starch, Bengal Tea & Fab, B & A, Narmada Agrobase, Jeyyam Global, and Mayank Cattle Fo, and the rest. Below Average management risk is noted at Zeal Aqua. Growth is Good at Choksi Asia and Average at Mayank Cattle Fo, Jeyyam Global, and the rest, while Below Average growth is seen at Zeal Aqua, Tirupati Starch, Bengal Tea & Fab, B & A, Ganges Securitie, Narmada Agrobase, Aayush Wellness. Capital Structure is Excellent at Ganges Securitie, Good at Choksi Asia and Aayush Wellness, Average at B & A, Narmada Agrobase, and Mayank Cattle Fo, and Below Average at Zeal Aqua, Tirupati Starch, and the rest.<BR><BR>Return Snapshot: Choksi Asia has the highest 1-year return at 110.20%, while Aayush Wellness has the lowest at -82.76%. Mayank Cattle Fo's 1-year return is not available for comparison. Additionally, Ganges Securitie, Narmada Agrobase, Aayush Wellness, and Tirupati Starch have negative six-month returns.

View full answer

How big is Mayank Cattle Fo?

14-Aug-2026

As of 14th August, Mayank Cattle Food Ltd has a market capitalization of 124.79 Cr, with recent net sales of 179.46 Cr and a net profit of 2.04 Cr for the quarter ending September 2024.

As of 14th August, Mayank Cattle Food Ltd has a market capitalization of 124.79 Cr, classifying it as a Micro Cap company.<BR><BR>In the latest quarter ending September 2024, Mayank Cattle Food reported Net Sales of 179.46 Cr and a Net Profit of 2.04 Cr.<BR><BR>The latest annual period for the balance sheet is March 2025, where Shareholder's Funds are recorded at 32.13 Cr and Total Assets amount to 72.64 Cr.

View full answer

What is the bonus history of Mayank Cattle Fo?

11-Aug-2026

Mayank Cattle Food Ltd has a notable bonus history, with its most recent announcement of a 1:1 bonus issue, effective from the ex-date of August 24, 2026. Shareholders on record by that date will receive one additional share for each share they own.

Mayank Cattle Food Ltd has a notable bonus history, with its latest announcement being a 1:1 bonus issue. The ex-date for this bonus is set for August 24, 2026. This means that shareholders on record as of that date will receive one additional share for every share they own.

View full answer

Should I buy, sell or hold Mayank Cattle Food Ltd?

23-Jun-2026

Are Mayank Cattle Fo latest results good or bad?

29-Oct-2025

Mayank Cattle Food's latest results show a 5% revenue decline and a 10% drop in net profit, leading to a 'Sell' recommendation from MarketsMOJO. Overall, the results are unfavorable, and investors should proceed with caution.

The latest results for Mayank Cattle Food indicate a decline in financial performance, which can be viewed as concerning. The company reported a 5% decrease in revenue and a 10% decline in net profit compared to the previous quarter. This downturn has led to a 'Sell' recommendation from MarketsMOJO, suggesting that analysts are wary of the company's current outlook.<BR><BR>Despite these challenges, Mayank Cattle Food remains committed to its mission and continues to expand its product offerings. As a microcap company, it faces inherent volatility and risks, but there is also potential for long-term growth. Overall, the recent results are not favorable, and investors may want to approach with caution while considering their options.

View full answer

How has been the historical performance of Mayank Cattle Fo?

29-Oct-2025

For the fiscal year ending March 2025, Mayank Cattle Fo reported a total operating income of 392.43 crore, with a profit after tax of 5.07 crore and an earnings per share (EPS) of 9.33, resulting in operating and profit after tax margins of 3.35% and 1.29%, respectively. The company's financial position is balanced, with total liabilities and assets both at 72.64 crore.

Answer:<BR>The historical performance of Mayank Cattle Fo for the year ending March 2025 shows a total operating income of 392.43 crore, with a total expenditure of 379.29 crore, resulting in an operating profit (PBDIT) of 13.51 crore. After accounting for interest and depreciation, the profit before tax stands at 7.25 crore, leading to a profit after tax of 5.07 crore. The consolidated net profit is reported at 5.04 crore, with an earnings per share (EPS) of 9.33. The operating profit margin is 3.35%, while the profit after tax margin is 1.29%. <BR><BR>Breakdown:<BR>In the fiscal year ending March 2025, Mayank Cattle Fo achieved net sales of 392.43 crore, with no other operating income reported. The raw material cost was significant at 364.86 crore, contributing to a total expenditure of 379.29 crore, which included employee costs and other expenses. This resulted in an operating profit of 13.51 crore, leading to a profit before tax of 7.25 crore after interest expenses. Following tax deductions, the profit after tax was recorded at 5.07 crore, culminating in a consolidated net profit of 5.04 crore. The company reported an EPS of 9.33, with operating and profit after tax margins of 3.35% and 1.29%, respectively. The balance sheet reflects total liabilities of 72.64 crore against total assets of the same amount, indicating a balanced financial position.

View full answer

Is Mayank Cattle Fo overvalued or undervalued?

16-Oct-2025

As of October 15, 2025, Mayank Cattle Fo is considered very attractive and undervalued, with a PE ratio of 22.82 and an EV to EBITDA ratio of 11.51, significantly lower than peers like Hindustan Unilever and Nestle India, despite a year-to-date stock decline of 12.5%.

As of 15 October 2025, the valuation grade for Mayank Cattle Fo has moved from risky to very attractive, indicating a significant improvement in its investment appeal. The company is currently assessed as undervalued. Key ratios supporting this assessment include a PE ratio of 22.82, an EV to EBITDA ratio of 11.51, and a PEG ratio of 0.36, which suggests that the stock is priced favorably relative to its growth potential.<BR><BR>In comparison to peers, Mayank Cattle Fo stands out with a much lower PE ratio than Hindustan Unilever at 55.69 and Nestle India at 78.3, both of which are classified as very expensive. Additionally, the company's EV to EBITDA ratio of 11.51 is significantly more attractive than the ratios of its peers, reinforcing the undervaluation narrative. Despite recent stock performance lagging behind the Sensex, with a year-to-date decline of 12.5% compared to a 5.72% gain in the index, the fundamental metrics suggest that Mayank Cattle Fo presents a compelling investment opportunity at its current price of 210.00.

View full answer

Who are the top shareholders of the Mayank Cattle Fo?

17-Jul-2025

The top shareholder of Mayank Cattle Fo is Ajay Popatlal Vachhani, holding 17.5%, with no pledged promoter holdings. The highest public shareholder is Gemzar Enterprises Private Limited at 2.38%, while individual investors collectively own 22.6% of the shares.

The top shareholders of Mayank Cattle Fo include the promoters, with Ajay Popatlal Vachhani holding the largest share at 17.5%. There are no pledged promoter holdings, and the company does not have any mutual fund or foreign institutional investor (FII) holdings. The highest public shareholder is Gemzar Enterprises Private Limited, which holds 2.38%. Additionally, individual investors collectively hold 22.6% of the shares.

View full answer

What is the technical trend for Mayank Cattle Fo?

09-Jun-2025

As of June 6, 2025, Mayank Cattle Fo's technical trend is neutral with a slight bearish inclination, indicated by a mildly bearish MACD, bearish RSI, and underperformance against the Sensex, despite mildly bullish daily moving averages.

As of 6 June 2025, the technical trend for Mayank Cattle Fo has changed from mildly bullish to sideways. The weekly MACD indicates a mildly bearish stance, while the monthly RSI shows a bearish signal. Daily moving averages are mildly bullish, but the overall picture is clouded by the sideways movement in Bollinger Bands and the lack of a clear trend in Dow Theory on a monthly basis. The stock has underperformed against the Sensex over the past month and year-to-date, suggesting weakness in the current momentum. Overall, the technical stance is neutral with a slight bearish inclination.

View full answer

When is the next results date for Mayank Cattle Fo?

06-Jun-2025

No Upcoming Board Meetings

Has Mayank Cattle Fo declared dividend?

06-Jun-2025

No Dividend History Available

iScoreScore
Click here to find our call on this stock
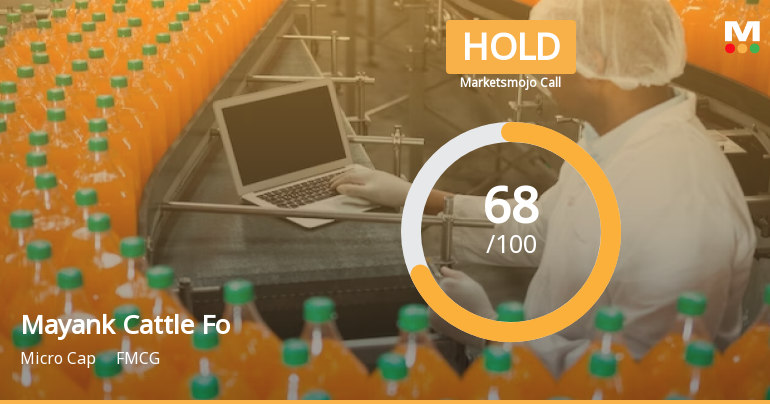
Strong Sell
Sell
Hold
Buy
Strong Buy

Dashboard

1

Low ability to service debt as the company has a high Debt to EBITDA ratio of 2.97 times

  • Low ability to service debt as the company has a high Debt to EBITDA ratio of 2.97 times
2

Flat results in Sep 24

3

With ROCE of 14.2, it has a Very Attractive valuation with a 2.2 Enterprise value to Capital Employed

4

Market Beating Performance

stock-summaryMojo Parameters

Mojo Parameters

Loading Valuation Snapshot...

Stock DNA

stock-summary
Industry

FMCG

stock-summary
Market cap

INR 136 Cr (Micro Cap)

stock-summary
P/E

22.00

stock-summary
Industry P/E

45

stock-summary
Dividend Yield

0.00%

stock-summary
Debt Equity

1.04

stock-summary
Return on Equity

15.81%

stock-summary
Price to Book

3.54

Revenue and Profits:
Net Sales:
(Quarterly Results - )
Net Profit:
stock-summaryTotal Returns
Total Returns (Price + Dividend) stock-summary
Dividend Yield (0%)
TimePeriod
Price Return
Dividend Return
Total Return
3 Months
32.35%
0%
32.35%
6 Months
0%
0%
0.0%
1 Year
13.51%
0%
13.51%
2 Years
29.56%
0%
29.56%
3 Years
0%
0%
0.0%
4 Years
0%
0%
0.0%
5 Years
0%
0%
0.0%

Mayank Cattle Fo for the last several years.

Risk Adjusted Returns v/s stock-summary
Returns Beta
Icon
Beta has not been calculated since enough price history is not available
stock-summaryNews & Corporate Actions

Announcements stock-summary

Shareholder Meeting / Postal Ballot-Scrutinizers Report

08-Aug-2026 | Source : BSE

Voting Result for the 28th Annual General Meeting of the Company.

Intimation Of Record Date Of 24Th August 2026 For Issue Of Bonus Equity Shares.

08-Aug-2026 | Source : BSE

Intimation of Record Date of 24th August 2026 for determining entitlement of equity shareholders for the purpose of issue of bonus equity shares in the ratio of 1:1

Shareholder Meeting / Postal Ballot-Outcome of AGM

06-Aug-2026 | Source : BSE

Intimation of Proceeding of the 28th Annual General Meeting held on 06th August 2026 of the company.

Corporate Actions stock-summary

stock-summary
BOARD MEETING

No Upcoming Board Meetings

stock-summary
DIVIDEND

No Dividend history available

stock-summary
SPLITS

No Splits history available

stock-summary
BONUS

Mayank Cattle Food Ltd has announced 1:1 bonus issue, ex-date: 24 Aug 26

stock-summary
RIGHTS

No Rights history available

stock-summaryKey Factors

Quality key factors stock-summary

Factor
Value
Sales Growth (5y)
5.70%
EBIT Growth (5y)
37.01%
EBIT to Interest (avg)
2.21
Debt to EBITDA (avg)
2.72
Net Debt to Equity (avg)
1.04
Sales to Capital Employed (avg)
5.62
Tax Ratio
27.29%
Dividend Payout Ratio
0
Pledged Shares
0.10%
Institutional Holding
0
ROCE (avg)
15.21%
ROE (avg)
15.66%

Valuation key factors

Factor
Value
P/E Ratio
22
Industry P/E
45
Price to Book Value
3.54
EV to EBIT
15.82
EV to EBITDA
12.98
EV to Capital Employed
2.24
EV to Sales
0.43
PEG Ratio
1.06
Dividend Yield
NA
ROCE (Latest)
14.17%
ROE (Latest)
15.81%

Technicals key factors

Indicator
Weekly
Monthly
MACD
Bullish
RSI
Bearish
No Signal
Bollinger Bands
Bullish
Bullish
Moving Averages
Bullish (Daily)
KST
Bullish
Dow Theory
Mildly Bullish
Mildly Bullish
stock-summary Technical Indicator Scale: Bearish, Mildly Bearish, Sideways, Mildly Bullish, Bullish  Turned 
stock-summaryShareholding
Shareholding Snapshot : Mar 2026stock-summary
Shareholding Compare (%holding) stock-summary
Majority shareholders

Promoters

Pledged Promoter Holdings

0.1026

Mutual Funds

Held by 0 Schemes

FIIs

Held by 0 FIIs

Promoter with highest holding

Ajay Popatlal Vachhani (17.5%)

Highest Public shareholder

Gemzar Enterprises Private Limited (2.38%)

Individual Investors Holdings

22.76%

stock-summaryFinancial
[
  {
    "link": "quarterly",
    "btn_text": "All Quarterly Results",
    "alert": "No Quarterly Results declared by Mayank Cattle Fo"
  },
  {
    "link": "half-yearly",
    "btn_text": "All Half Yearly Results",
    "header": "Half Yearly Results Snapshot (Consolidated) - Sep'25",
    "rhs": [
      {
        "prefix": "Net Sales ",
        "suffix": " Growth in half year ended Sep 2025 is -12.25% vs 18.67% in Mar 2025",
        "dir": -1
      },
      {
        "prefix": "Consolidated Net Profit ",
        "suffix": " Growth in half year ended Sep 2025 is -15.72% vs 46.57% in Mar 2025",
        "dir": -1
      }
    ],
    "table": {
      "header": [
        "Sep'25",
        "Mar'25",
        "Change(%)"
      ],
      "body": [
        {
          "field": "Net Sales",
          "val1": "186.88",
          "val2": "212.97",
          "chgp": "-12.25%",
          "chgp_class": "negative"
        },
        {
          "field": "Operating Profit (PBDIT) excl Other Income",
          "val1": "6.31",
          "val2": "7.23",
          "chgp": "-12.72%",
          "chgp_class": "negative"
        },
        {
          "field": "Interest",
          "val1": "1.69",
          "val2": "1.78",
          "chgp": "-5.06%",
          "chgp_class": "positive"
        },
        {
          "field": "Exceptional Items",
          "val1": "0.00",
          "val2": "0.00",
          "chgp": "",
          "chgp_class": "neutral"
        },
        {
          "field": "Consolidate Net Profit",
          "val1": "2.52",
          "val2": "2.99",
          "chgp": "-15.72%",
          "chgp_class": "negative"
        },
        {
          "field": "Operating Profit Margin (Excl OI)",
          "val1": "3.38%",
          "val2": "3.39%",
          "chgp": "-0.01%",
          "chgp_class": "negative"
        }
      ]
    }
  },
  {
    "link": "nine-monthly",
    "btn_text": "All Nine Monthly Results",
    "header": "Nine Monthly Results Snapshot (Consolidated) - Sep'24",
    "rhs": [
      {
        "prefix": "Net Sales ",
        "suffix": "Not Applicable: The company has declared_date for only one period",
        "dir": 0
      },
      {
        "prefix": "Consolidated Net Profit ",
        "suffix": "Not Applicable: The company has declared_date for only one period",
        "dir": 0
      }
    ],
    "table": {
      "header": [
        "Sep'24",
        "",
        "Change(%)"
      ],
      "body": [
        {
          "field": "Net Sales",
          "val1": "366.34",
          "val2": "NA",
          "chgp": "NA",
          "chgp_class": "neutral"
        },
        {
          "field": "Operating Profit (PBDIT) excl Other Income",
          "val1": "12.22",
          "val2": "NA",
          "chgp": "NA",
          "chgp_class": "neutral"
        },
        {
          "field": "Interest",
          "val1": "3.62",
          "val2": "NA",
          "chgp": "NA",
          "chgp_class": "neutral"
        },
        {
          "field": "Exceptional Items",
          "val1": "0.00",
          "val2": "NA",
          "chgp": "NA",
          "chgp_class": "neutral"
        },
        {
          "field": "Consolidate Net Profit",
          "val1": "4.56",
          "val2": "NA",
          "chgp": "NA",
          "chgp_class": "neutral"
        },
        {
          "field": "Operating Profit Margin (Excl OI)",
          "val1": "3.34%",
          "val2": "NA%",
          "chgp": "NA",
          "chgp_class": "neutral"
        }
      ]
    }
  },
  {
    "link": "annual",
    "btn_text": "All Annual Results",
    "header": "Annual Results Snapshot (Standalone) - Mar'25",
    "rhs": [
      {
        "prefix": "Net Sales ",
        "suffix": "YoY Growth in year ended Mar 2025 is 34.64% vs -6.11% in Mar 2024",
        "dir": 1
      },
      {
        "prefix": "Standalone Net Profit ",
        "suffix": "YoY Growth in year ended Mar 2025 is 64.03% vs 138.58% in Mar 2024",
        "dir": -1
      }
    ],
    "table": {
      "header": [
        "Mar'25",
        "Mar'24",
        "Change(%)"
      ],
      "body": [
        {
          "field": "Net Sales",
          "val1": "390.86",
          "val2": "290.30",
          "chgp": "34.64%",
          "chgp_class": "positive"
        },
        {
          "field": "Operating Profit (PBDIT) excl Other Income",
          "val1": "12.93",
          "val2": "9.35",
          "chgp": "38.29%",
          "chgp_class": "positive"
        },
        {
          "field": "Interest",
          "val1": "3.65",
          "val2": "3.43",
          "chgp": "6.41%",
          "chgp_class": "negative"
        },
        {
          "field": "Exceptional Items",
          "val1": "0.00",
          "val2": "0.00",
          "chgp": "",
          "chgp_class": "neutral"
        },
        {
          "field": "Standalone Net Profit",
          "val1": "4.97",
          "val2": "3.03",
          "chgp": "64.03%",
          "chgp_class": "positive"
        },
        {
          "field": "Operating Profit Margin (Excl OI)",
          "val1": "3.31%",
          "val2": "3.22%",
          "chgp": "0.09%",
          "chgp_class": "positive"
        }
      ]
    }
  }
]

Half Yearly Results Snapshot (Consolidated) - Sep'25stock-summary

Sep'25
Mar'25
Change(%)
Net Sales
186.88
212.97
-12.25%
Operating Profit (PBDIT) excl Other Income
6.31
7.23
-12.72%
Interest
1.69
1.78
-5.06%
Exceptional Items
0.00
0.00
Consolidate Net Profit
2.52
2.99
-15.72%
Operating Profit Margin (Excl OI)
3.38%
3.39%
-0.01%
Values in Rs Cr.
Direction Arrows
Net Sales

Growth in half year ended Sep 2025 is -12.25% vs 18.67% in Mar 2025

Direction Arrows
Consolidated Net Profit

Growth in half year ended Sep 2025 is -15.72% vs 46.57% in Mar 2025

Nine Monthly Results Snapshot (Consolidated) - Sep'24stock-summary

Sep'24
Change(%)
Net Sales
366.34
NA
NA
Operating Profit (PBDIT) excl Other Income
12.22
NA
NA
Interest
3.62
NA
NA
Exceptional Items
0.00
NA
NA
Consolidate Net Profit
4.56
NA
NA
Operating Profit Margin (Excl OI)
3.34%
NA%
NA
Values in Rs Cr.
Net Sales

Not Applicable: The company has declared_date for only one period

Consolidated Net Profit

Not Applicable: The company has declared_date for only one period

Annual Results Snapshot (Standalone) - Mar'25stock-summary

Mar'25
Mar'24
Change(%)
Net Sales
390.86
290.30
34.64%
Operating Profit (PBDIT) excl Other Income
12.93
9.35
38.29%
Interest
3.65
3.43
6.41%
Exceptional Items
0.00
0.00
Standalone Net Profit
4.97
3.03
64.03%
Operating Profit Margin (Excl OI)
3.31%
3.22%
0.09%
Values in Rs Cr.
Direction Arrows
Net Sales

YoY Growth in year ended Mar 2025 is 34.64% vs -6.11% in Mar 2024

Direction Arrows
Standalone Net Profit

YoY Growth in year ended Mar 2025 is 64.03% vs 138.58% in Mar 2024

stock-summaryCompany CV
About Mayank Cattle Food Ltd stock-summary
stock-summary
Mayank Cattle Food Ltd
Micro Cap
FMCG
Mayank Cattle Food Limited was originally incorporated as Private Limited Company in the name of "Mayank Cattle Food Private Limited" on April 21, 1998 issued by Registrar of Companies, Gujarat, Dadra & Nagar Havelli. Subsequently, Company got converted into Public Limited Company and name of the Company was changed to "Mayank Cattle Food Limited" vide a fresh Certificate of Incorporation dated June 23, 2023 issued by Registrar of Companies, Ahmedabad.
Company Coordinates stock-summary
Icon
No Company Details Available