
Compare MBL Infrast with Similar Stocks
Dashboard
Weak Long Term Fundamental Strength with an average Return on Capital Employed (ROCE) of 0%
- Poor long term growth as Net Sales has grown by an annual rate of 0.20% and Operating profit at 6.82% over the last 5 years
- Low ability to service debt as the company has a high Debt to EBITDA ratio of -72.97 times
Risky - Negative EBITDA
Underperformed the market in the last 1 year
Stock DNA
Construction
INR 412 Cr (Micro Cap)
NA (Loss Making)
43
0.00%
0.98
-4.10%
0.41
Total Returns (Price + Dividend) 
Latest dividend: 1.5 per share ex-dividend date: Aug-04-2016
Risk Adjusted Returns v/s
Returns Beta

News
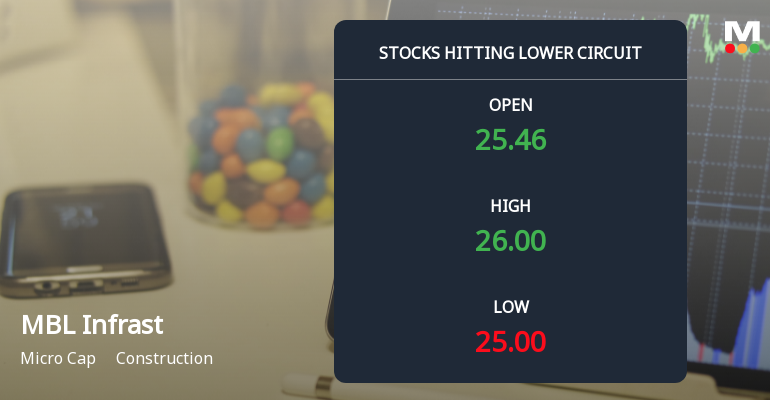
MBL Infrastructure Ltd Locks at Lower Circuit With 5% Loss — Sellers Queue, No Buyers in Sight
At Rs 24.69, sellers were still queuing — but there were no buyers willing to take the other side. MBL Infrastructure Ltd locked at its lower circuit of 5% on 11 Jun 2026, with unfilled sell orders and a frozen price that capped losses for the day.
Read full news article
MBL Infrastructure Ltd is Rated Strong Sell
MBL Infrastructure Ltd is rated Strong Sell by MarketsMOJO, with this rating last updated on 27 Jan 2025. However, the analysis and financial metrics discussed here reflect the stock’s current position as of 10 June 2026, providing investors with an up-to-date perspective on the company’s fundamentals, valuation, financial trends, and technical outlook.
Read full news article
Below All Moving Averages and Now at Lower Circuit: MBL Infrastructure Ltd Loses 8.62% in a Single Session
At Rs 28.71, sellers were still queuing — but there were no buyers willing to take the other side. MBL Infrastructure Ltd locked at its lower circuit of 10% on 8 Jun 2026, with unfilled sell orders and a frozen price, reflecting a sharp 8.62% decline on the day.
Read full news article Announcements
Disclosures under Reg. 29(1) of SEBI (SAST) Regulations 2011
01-Jun-2026 | Source : BSEThe Exchange has received the disclosure under Regulation 29(1) of SEBI (Substantial Acquisition of Shares & Takeovers) Regulations 2011 for Anjanee Kumar Lakhotia
Board Meeting Outcome for Outcome Of Board Meeting 30.05.2026
30-May-2026 | Source : BSEOutcome of Board Meeting 30.05.2026
Compliances-Reg.24(A)-Annual Secretarial Compliance
26-May-2026 | Source : BSEAnnual Secretarial Compliance Report 31.03.2026
Corporate Actions

No Upcoming Board Meetings

MBL Infrastructure Ltd has declared 15% dividend, ex-date: 04 Aug 16

No Splits history available

MBL Infrastructure Ltd has announced 1:1 bonus issue, ex-date: 28 Jul 15

No Rights history available
Quality key factors
Valuation key factors
Technicals key factors
 Technical Indicator Scale: Bearish, Mildly Bearish, Sideways, Mildly Bullish, Bullish Turned
 Shareholding Snapshot : Apr 2026
Shareholding Compare (%holding)
Promoters
23.6027
Held by 0 Schemes
Held by 2 FIIs (0.08%)
Mbl A Capital Limited (20.84%)
Prabhu International Vyapar Pvt Ltd (1.41%)
17.5%
Quarterly Results Snapshot (Consolidated) - Mar'26 - YoY

YoY Growth in quarter ended Mar 2026 is 67.40% vs 29.66% in Mar 2025
YoY Growth in quarter ended Mar 2026 is 82.17% vs -320.37% in Mar 2025
Half Yearly Results Snapshot (Consolidated) - Sep'25
Growth in half year ended Sep 2025 is 16.64% vs 1.54% in Sep 2024

Growth in half year ended Sep 2025 is -101.93% vs 1,420.69% in Sep 2024
Nine Monthly Results Snapshot (Consolidated) - Dec'25
YoY Growth in nine months ended Dec 2025 is 32.27% vs -1.24% in Dec 2024
YoY Growth in nine months ended Dec 2025 is -106.53% vs 873.72% in Dec 2024
Annual Results Snapshot (Consolidated) - Mar'26
YoY Growth in year ended Mar 2026 is 37.20% vs 4.83% in Mar 2025
YoY Growth in year ended Mar 2026 is -113.35% vs 530.94% in Mar 2025
About MBL Infrastructure Ltd

Company Coordinates


