
Compare MDA Ltd. with Similar Stocks
Dashboard
1
Healthy long term growth as Net Sales has grown by an annual rate of 68.55% and Operating profit at 29.01%
2
With a growth in Net Sales of 6.35%, the company declared Very Positive results in Jun 25
3
With ROE of 8.76%, it has a attractive valuation with a 3.10 Price to Book Value
4
Majority shareholders : FIIs
5
Consistent Returns over the last 3 years
Total Returns (Price + Dividend) 
TimePeriod
Price Return
Dividend Return
Total Return
3 Months
37.2%
0%
37.2%
6 Months
33.64%
0%
33.64%
1 Year
217.24%
0%
217.24%
2 Years
362.38%
0%
362.38%
3 Years
340.46%
0%
340.46%
4 Years
156.22%
0%
156.22%
5 Years
0%
0%
0.0%
MDA Ltd. for the last several years.
Risk Adjusted Returns v/s
News
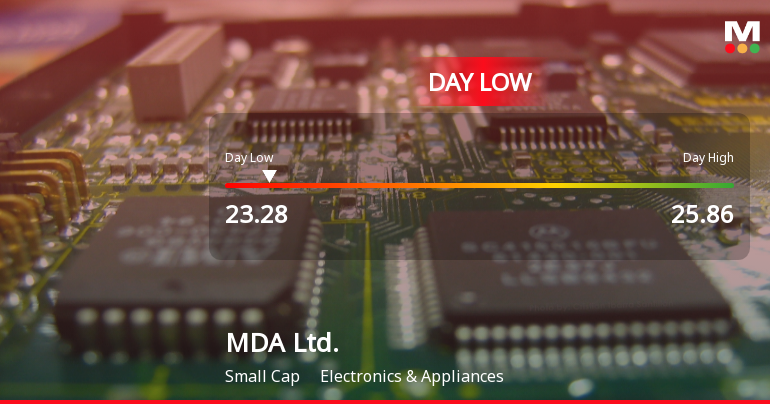
MDA Ltd. Hits Day Low of CAD 23.28 Amid Price Pressure
MDA Ltd. faced a notable decline in its stock price, dropping significantly today and over the past week and month. Despite these short-term challenges, the company has shown impressive long-term growth metrics, including substantial increases in net sales and profit, and has outperformed the S&P/TSX 60 over the last three years.
Read full news article Announcements

No announcement available
Corporate Actions
No corporate action available
Quality key factors
Factor
Value
Sales Growth (5y)
76.93%
EBIT Growth (5y)
28.52%
EBIT to Interest (avg)
0.51
Debt to EBITDA (avg)
1.76
Net Debt to Equity (avg)
-0.29
Sales to Capital Employed (avg)
0.71
Tax Ratio
4.00%
Dividend Payout Ratio
0
Pledged Shares
0
Institutional Holding
0.17%
ROCE (avg)
4.03%
ROE (avg)
4.19%
Valuation key factors
Factor
Value
P/E Ratio
40
Industry P/E
Price to Book Value
3.49
EV to EBIT
34.00
EV to EBITDA
18.83
EV to Capital Employed
4.60
EV to Sales
3.01
PEG Ratio
0.29
Dividend Yield
NA
ROCE (Latest)
13.54%
ROE (Latest)
8.76%
Technicals key factors
Indicator
Weekly
Monthly
MACD
Bullish
Mildly Bearish
RSI
No Signal
No Signal
Bollinger Bands
Mildly Bullish
Mildly Bullish
Moving Averages
Mildly Bearish (Daily)
KST
Mildly Bullish
Mildly Bearish
Dow Theory
No Trend
No Trend
OBV
No Trend
No Trend
 Technical Indicator Scale: Bearish, Mildly Bearish, Sideways, Mildly Bullish, Bullish Turned
 Shareholding Snapshot : Sep 2025
Shareholding Compare (%holding)
Majority shareholders
Foreign Institutions
Domestic Funds
Held in 0 Schemes (0%)
Foreign Institutions
Held by 1 Foreign Institutions (0.17%)
Strategic Entities with highest holding
Highest Public shareholder
Quarterly Results Snapshot (Consolidated) - Jun'25 - QoQ
Jun'25
Mar'25
Change(%)
Net Sales
373.30
351.00
6.35%
Operating Profit (PBDIT) excl Other Income
64.00
60.60
5.61%
Interest
2.90
4.90
-40.82%
Exceptional Items
2.60
0.10
2,500.00%
Consolidate Net Profit
27.20
32.90
-17.33%
Operating Profit Margin (Excl OI)
102.90%
100.60%
0.23%
USD in Million.

Net Sales
QoQ Growth in quarter ended Jun 2025 is 6.35% vs 1.27% in Mar 2025

Consolidated Net Profit
QoQ Growth in quarter ended Jun 2025 is -17.33% vs 31.08% in Mar 2025
Annual Results Snapshot (Consolidated) - Dec'24
Dec'24
Dec'23
Change(%)
Net Sales
1,080.10
807.60
33.74%
Operating Profit (PBDIT) excl Other Income
155.50
123.30
26.12%
Interest
28.00
8.60
225.58%
Exceptional Items
1.20
-0.80
250.00%
Consolidate Net Profit
79.40
48.80
62.70%
Operating Profit Margin (Excl OI)
59.70%
56.00%
0.37%
USD in Million.
Net Sales
YoY Growth in year ended Dec 2024 is 33.74% vs 25.95% in Dec 2023
Consolidated Net Profit
YoY Growth in year ended Dec 2024 is 62.70% vs 85.55% in Dec 2023
About MDA Ltd.

MDA Ltd.
Electronics & Appliances
No Details Available.
Company Coordinates
No Company Details Available
InfinHub Market Technologies FZ-LLC, Building-2, Unit 112, Dubai Internet City, Dubai, United Arab Emirates
GET THE MARKETSMOJO APP


Company
Stocks
Portfolio


"Investment in securities markets are subject to market risk. Read all the related documents carefully before investing."