
Compare MDU Resources Group, Inc. with Similar Stocks
Dashboard
Poor long term growth as Operating profit has grown by an annual rate -8.60% of over the last 5 years
With a fall in Operating Profit of -47.44%, the company declared Very Negative results in Jun 25
With ROCE of 7.95%, it has a expensive valuation with a 1.14 Enterprise value to Capital Employed
Underperformed the market in the last 1 year
Total Returns (Price + Dividend) 
MDU Resources Group, Inc. for the last several years.
Risk Adjusted Returns v/s
News
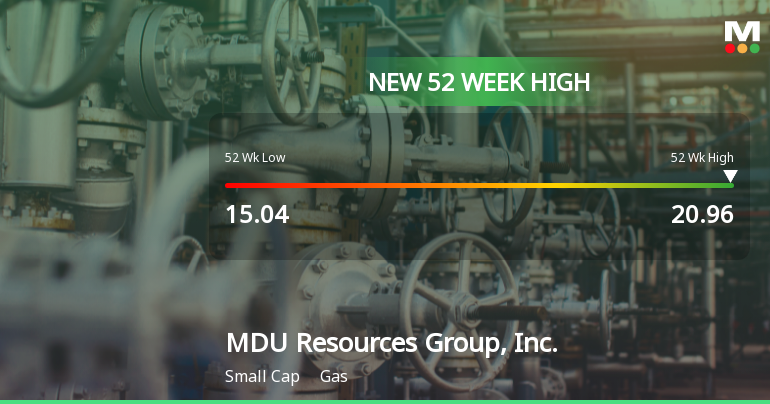
MDU Resources Group Hits New 52-Week High of $20.96
MDU Resources Group, Inc. achieved a new 52-week high of USD 20.96 on November 7, 2025, reflecting strong performance in the gas industry. The company has seen a 52.07% growth over the past year, with a competitive P/E ratio and a dividend yield of 3.21%.
Read full news article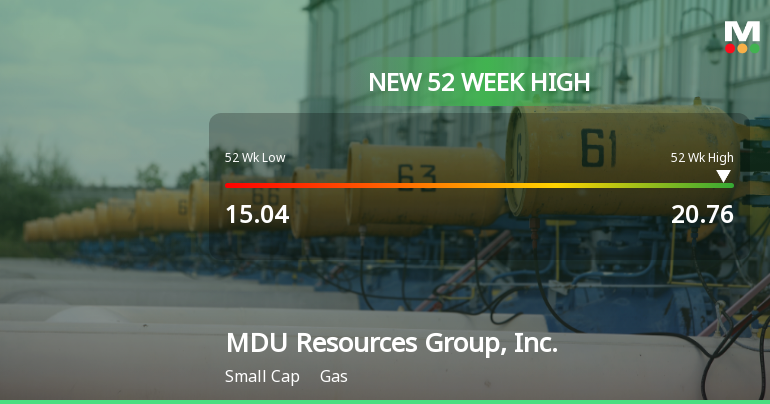
MDU Resources Group Hits New 52-Week High of $20.76
MDU Resources Group, Inc. achieved a new 52-week high of USD 20.76 on November 6, 2025, reflecting strong performance in the gas industry with a 50.03% increase over the past year. The company has a market cap of USD 3,298 million and a competitive P/E ratio of 13.00.
Read full news article Announcements

Corporate Actions
Quality key factors
Valuation key factors
Technicals key factors
 Technical Indicator Scale: Bearish, Mildly Bearish, Sideways, Mildly Bullish, Bullish Turned
 Shareholding Snapshot : Sep 2025
Shareholding Compare (%holding)
Domestic Funds
Held in 96 Schemes (55.85%)
Held by 139 Foreign Institutions (8.79%)
Quarterly Results Snapshot (Consolidated) - Jun'25 - QoQ

QoQ Growth in quarter ended Jun 2025 is -47.95% vs 26.01% in Mar 2025
QoQ Growth in quarter ended Jun 2025 is -82.79% vs 17.02% in Mar 2025
Annual Results Snapshot (Consolidated) - Dec'24

YoY Growth in year ended Dec 2024 is -2.52% vs -59.40% in Dec 2023
YoY Growth in year ended Dec 2024 is -45.14% vs 31.62% in Dec 2023
About MDU Resources Group, Inc.

Company Coordinates


