
Compare Media Matrix with Similar Stocks
Dashboard
Weak Long Term Fundamental Strength with an average Return on Capital Employed (ROCE) of 8.99%
- Poor long term growth as Net Sales has grown by an annual rate of 2.50% and Operating profit at 15.22% over the last 5 years
- Company's ability to service its debt is weak with a poor EBIT to Interest (avg) ratio of 1.21
Positive results in Mar 26
With ROCE of 14.1, it has a Very Expensive valuation with a 11.6 Enterprise value to Capital Employed
Despite the size of the company, domestic mutual funds hold only 0% of the company
Stock DNA
Media & Entertainment
INR 1,586 Cr (Micro Cap)
266.00
NA
0.00%
1.09
8.72%
23.21
Total Returns (Price + Dividend) 
Media Matrix for the last several years.
Risk Adjusted Returns v/s
Returns Beta

News
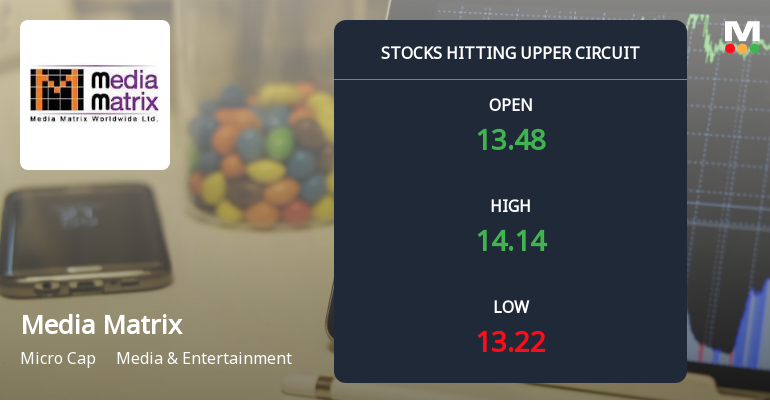
Media Matrix Worldwide Ltd Locks at Upper Circuit With 4.97% Gain — Buyers Queue, Sellers Absent
At Rs 14.14, the buying was done — not because demand dried up, but because the exchange wouldn't let the stock go any higher. Media Matrix Worldwide Ltd locked at its upper circuit of 4.97% on 16 Jul 2026, with buyers queuing and no sellers willing to part with shares.
Read full news article
Media Matrix Worldwide Ltd Upgraded to Hold on Technical and Financial Improvements
Media Matrix Worldwide Ltd has seen its investment rating upgraded from Sell to Hold, reflecting a notable improvement in technical indicators and recent financial results. The company’s technical trend has shifted from mildly bullish to bullish, supported by strong quarterly earnings growth and a positive sales trajectory, although valuation concerns and long-term fundamental weaknesses temper enthusiasm.
Read full news article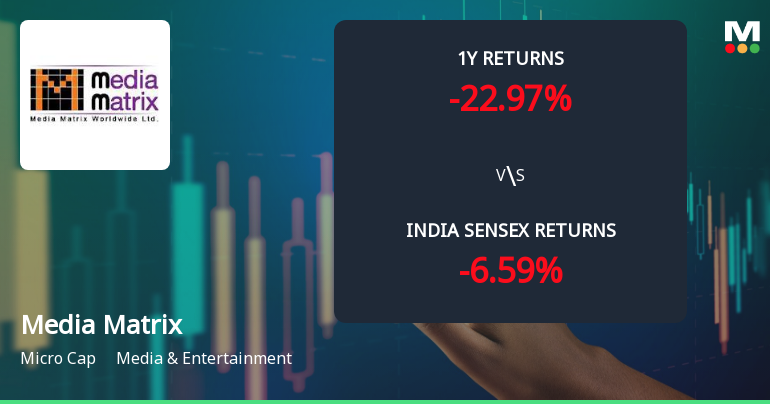
Media Matrix Worldwide Ltd Sees Bullish Momentum Shift Amid Technical Upgrades
Media Matrix Worldwide Ltd has witnessed a notable shift in its technical momentum, moving from a mildly bullish stance to a more confident bullish trend. This change is underscored by improvements across key technical indicators including MACD, moving averages, and Bollinger Bands, signalling renewed investor interest and potential upside in the micro-cap media and entertainment stock.
Read full news article Announcements
Compliances-Certificate under Reg. 74 (5) of SEBI (DP) Regulations 2018
09-Jul-2026 | Source : BSEIn accordance with Regulation 74(5) of the Securities and Exchange Board of India (Depositories and Participants) Regulations 2018 as amended we hereby submit a copy of the certificate received from MUFG Intime India Private Limited (formerly Link Intime India Private Limited) the Registrar and Share Transfer Agent of the Company for the quarter ended June 30 2026.
Issuance Of Corporate Guarantee On Behalf Of Nexg Devices Private Limited A Subsidiary Of The Company To The Extent Of Rs. 50 Crores In Substitution Of Earlier Corporate Guarantee Of Rs. 70 Crores.
01-Jul-2026 | Source : BSEThis is with reference to our earlier announcement dated October 09 2025. We would like to inform all our stakeholders that the Company has extended a Corporate Guarantee by execution of a Supplemental and Amendatory Deed of Guarantee in favour of Yes Bank Limited to secure various fund based and non-fund-based facilities availed/to be availed by nexG Devices Private Limited a subsidiary of the Company (nexG) to the extent of 50 Crores in substitution of earlier Corporate Guarantee of 70 Crores.
Closure of Trading Window
29-Jun-2026 | Source : BSEThis is to inform you that in compliance of the provisions of the SEBI (Prohibition of Insider Trading) Regulations 2015 (PIT Regulations) and the Companys Code of Internal Procedures and Conduct for Regulating Monitoring and Reporting of Trading in Securities by Designated Persons (the Code) the Trading Window for dealing in the securities of the Company for all the Designated Persons including their immediate relatives and others Insiders as per the Code shall remain closed with effect from June 30 2026 for the purpose of consideration of the Un-audited Financial Results both standalone and consolidated for the 01st quarter ending June 30 2026 and shall re-open after expiry of 48 hours from the declaration of the aforesaid Financial Results of the Company.
Corporate Actions

No Upcoming Board Meetings

No Dividend history available

No Splits history available

No Bonus history available

Media Matrix Worldwide Ltd has announced 9:1 rights issue, ex-date: 18 Mar 13
Quality key factors
Valuation key factors
Technicals key factors
 Technical Indicator Scale: Bearish, Mildly Bearish, Sideways, Mildly Bullish, Bullish Turned
 Shareholding Snapshot : Mar 2026
Shareholding Compare (%holding)
Promoters
None
Held by 0 Schemes
Held by 1 FIIs (0.0%)
Mn Ventures Private Limited (56.09%)
V And A Ventures Llp (23.27%)
4.37%
Quarterly Results Snapshot (Consolidated) - Mar'26 - QoQ

QoQ Growth in quarter ended Mar 2026 is -10.63% vs -12.89% in Dec 2025

QoQ Growth in quarter ended Mar 2026 is -7.84% vs 6.99% in Dec 2025
Half Yearly Results Snapshot (Consolidated) - Sep'25
Growth in half year ended Sep 2025 is -54.32% vs 44.72% in Sep 2024
Growth in half year ended Sep 2025 is -0.34% vs 45.05% in Sep 2024
Nine Monthly Results Snapshot (Consolidated) - Dec'25
YoY Growth in nine months ended Dec 2025 is -40.80% vs 42.31% in Dec 2024
YoY Growth in nine months ended Dec 2025 is 20.60% vs 11.14% in Dec 2024
Annual Results Snapshot (Consolidated) - Mar'26
YoY Growth in year ended Mar 2026 is -33.39% vs 33.33% in Mar 2025
YoY Growth in year ended Mar 2026 is 67.14% vs -30.14% in Mar 2025
About Media Matrix Worldwide Ltd

Company Coordinates


