
Compare Media Matrix with Similar Stocks
Dashboard
Weak Long Term Fundamental Strength with an average Return on Capital Employed (ROCE) of 8.99%
- Poor long term growth as Net Sales has grown by an annual rate of 2.50% and Operating profit at 15.22% over the last 5 years
- Company's ability to service its debt is weak with a poor EBIT to Interest (avg) ratio of 1.21
Positive results in Mar 26
With ROCE of 14.1, it has a Very Expensive valuation with a 10.9 Enterprise value to Capital Employed
Despite the size of the company, domestic mutual funds hold only 0% of the company
Stock DNA
Media & Entertainment
INR 1,511 Cr (Micro Cap)
248.00
61
0.00%
1.09
8.72%
22.45
Total Returns (Price + Dividend) 
Media Matrix for the last several years.
Risk Adjusted Returns v/s
Returns Beta

News

Media Matrix Worldwide Ltd is Rated Hold
Media Matrix Worldwide Ltd is rated 'Hold' by MarketsMOJO, with this rating last updated on 29 May 2026. However, the analysis and financial metrics presented here reflect the stock's current position as of 12 June 2026, providing investors with an up-to-date view of the company’s fundamentals, valuation, financial trends, and technical outlook.
Read full news article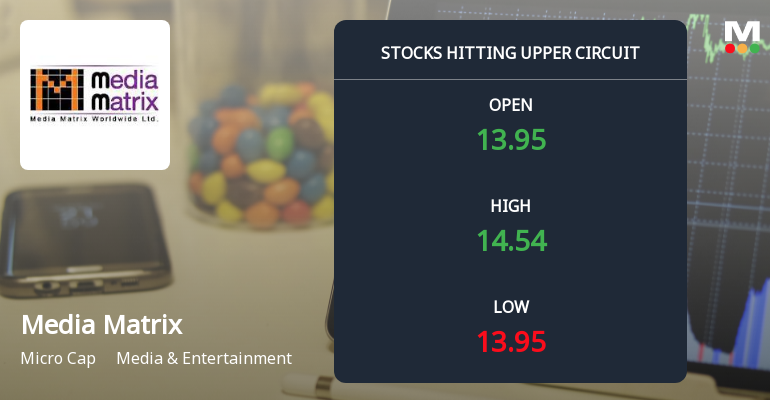
Media Matrix Worldwide Ltd Locks at Upper Circuit With 4.34% Gain — Buyers Queue, Sellers Absent
At Rs 14.51, the buying was done — not because demand dried up, but because the exchange wouldn't let the stock go any higher. Media Matrix Worldwide Ltd locked at its upper circuit of 4.34% on 1 Jun 2026, with buyers queuing and no sellers willing to part with shares.
Read full news article
Media Matrix Worldwide Ltd Upgraded to Hold by MarketsMOJO on Improved Technicals and Financial Trends
Media Matrix Worldwide Ltd has seen its investment rating upgraded from Sell to Hold, reflecting a notable improvement in its technical indicators and recent financial performance. The upgrade, effective from 29 May 2026, is underpinned by a bullish shift in technical trends, robust quarterly earnings growth, and a market-beating return profile despite valuation concerns and lingering fundamental challenges.
Read full news article Announcements
Announcement under Regulation 30 (LODR)-Newspaper Publication
28-May-2026 | Source : BSEThis is further to our earlier intimation dated March 31 2026 regarding the Special Window for re-lodgment of transfer requests of physical shares. In terms of SEBI Circular No. HO/38/13/11(2)2026-MIRSD-POD/I/3750/2026 dated January 30 2026 (SEBI Circular) a further special window has been opened for a period of one year from February 5 2026 to February 4 2027. In compliance with the same the Company has published newspaper advertisements containing details of the opening of the Special Window for transfer of physical shares in the following editions on Thursday May 28 2026: 1. Jansatta - Hindi (copy for Delhi Edition are attached) 2. Financial Express - English (copy for Delhi Edition are attached)
Compliances-Reg.24(A)-Annual Secretarial Compliance
26-May-2026 | Source : BSEIn terms of Regulation 24A of the SEBI Listing Regulations read with SEBI Master Circular No. HO/49/14/14(7)2025-CFD-POD2/I/3762/2026 dated January 30 2026 we are submitting herewith the Annual Secretarial Compliance Report of the Company for the year ended March 31 2026. Kindly take the same on your records.
Issuance Of Corporate Guarantee On Behalf Of Nexg Devices Private Limited A Subsidiary Of The Company.
13-May-2026 | Source : BSEWe would like to inform all our stakeholders that the Company has today given a Corporate Guarantee in favour of IndusInd Bank Limited to secure various fund based and non-fund-based facilities availed/to be availed by nexG Devices Private Limited a subsidiary of the Company (nexG) to the extent of Rs. 25 Crore.
Corporate Actions

No Upcoming Board Meetings

No Dividend history available

No Splits history available

No Bonus history available

Media Matrix Worldwide Ltd has announced 9:1 rights issue, ex-date: 18 Mar 13
Quality key factors
Valuation key factors
Technicals key factors
 Technical Indicator Scale: Bearish, Mildly Bearish, Sideways, Mildly Bullish, Bullish Turned
 Shareholding Snapshot : Mar 2026
Shareholding Compare (%holding)
Promoters
None
Held by 0 Schemes
Held by 1 FIIs (0.0%)
Mn Ventures Private Limited (56.09%)
V And A Ventures Llp (23.27%)
4.37%
Quarterly Results Snapshot (Consolidated) - Mar'26 - QoQ

QoQ Growth in quarter ended Mar 2026 is -10.63% vs -12.89% in Dec 2025

QoQ Growth in quarter ended Mar 2026 is -7.84% vs 6.99% in Dec 2025
Half Yearly Results Snapshot (Consolidated) - Sep'25
Growth in half year ended Sep 2025 is -54.32% vs 44.72% in Sep 2024
Growth in half year ended Sep 2025 is -0.34% vs 45.05% in Sep 2024
Nine Monthly Results Snapshot (Consolidated) - Dec'25
YoY Growth in nine months ended Dec 2025 is -40.80% vs 42.31% in Dec 2024
YoY Growth in nine months ended Dec 2025 is 20.60% vs 11.14% in Dec 2024
Annual Results Snapshot (Consolidated) - Mar'26
YoY Growth in year ended Mar 2026 is -33.39% vs 33.33% in Mar 2025
YoY Growth in year ended Mar 2026 is 67.14% vs -30.14% in Mar 2025
About Media Matrix Worldwide Ltd

Company Coordinates


