
Compare Medicamen Biotec with Similar Stocks
Dashboard
Poor long term growth as Operating profit has grown by an annual rate -15.30% of over the last 5 years
- PBT LESS OI(Q) At Rs 1.58 cr has Fallen at -57.75%
- ROCE(HY) Lowest at 4.69%
- DEBTORS TURNOVER RATIO(HY) Lowest at 2.13 times
Consistent Underperformance against the benchmark over the last 3 years
Stock DNA
Pharmaceuticals & Biotechnology
INR 366 Cr (Micro Cap)
39.00
35
0.37%
-0.02
3.88%
1.33
Total Returns (Price + Dividend) 
Latest dividend: 1 per share ex-dividend date: Sep-19-2025
Risk Adjusted Returns v/s
Returns Beta

News
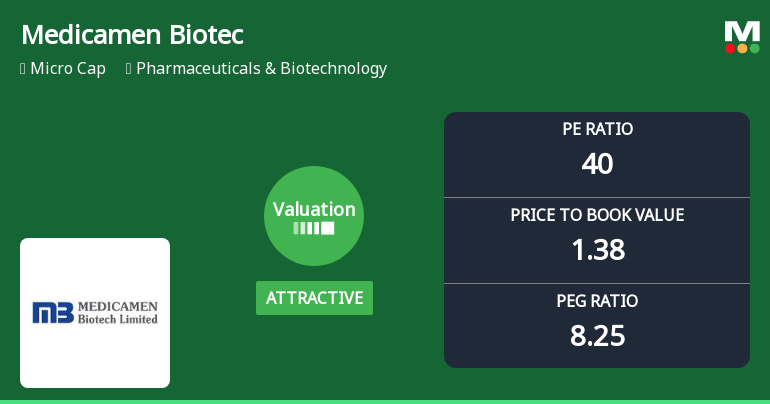
Medicamen Biotech Ltd Valuation Shifts Signal Renewed Price Attractiveness Amid Sector Challenges
Medicamen Biotech Ltd has witnessed a notable shift in its valuation parameters, moving from a fair to an attractive rating despite its historically high price-to-earnings (P/E) ratio. This change reflects evolving market perceptions amid a challenging performance backdrop, with the company’s micro-cap status and sector dynamics playing a crucial role in investor sentiment.
Read full news article
Medicamen Biotech Ltd is Rated Sell
Medicamen Biotech Ltd is rated 'Sell' by MarketsMOJO, with this rating last updated on 05 May 2026. While the rating change occurred on that date, the analysis and financial metrics discussed here reflect the stock's current position as of 17 May 2026, providing investors with an up-to-date view of the company’s fundamentals, returns, and market standing.
Read full news article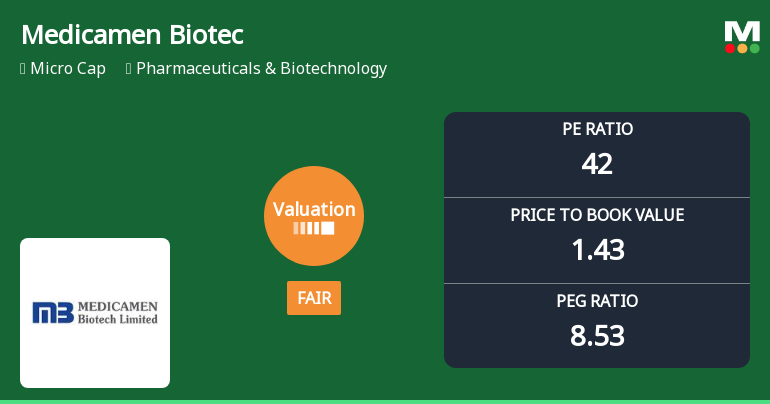
Medicamen Biotech Ltd Valuation Shifts Amidst Sector Challenges
Medicamen Biotech Ltd has seen a notable shift in its valuation parameters, moving from an attractive to a fair rating, reflecting changing market perceptions and relative peer positioning. Despite a recent downgrade in its Mojo Grade to Sell from Strong Sell, the company’s valuation metrics reveal a complex picture of price attractiveness amid sector volatility and competitive pressures.
Read full news article Announcements
Corporate Actions

No Upcoming Board Meetings

Medicamen Biotech Ltd has declared 10% dividend, ex-date: 19 Sep 25

No Splits history available

No Bonus history available

No Rights history available
Quality key factors
Valuation key factors
Technicals key factors
 Technical Indicator Scale: Bearish, Mildly Bearish, Sideways, Mildly Bullish, Bullish Turned
 Shareholding Snapshot : Mar 2026
Shareholding Compare (%holding)
Non Institution
None
Held by 0 Schemes
Held by 2 FIIs (0.1%)
Shivalik Rasayan Limited (40.46%)
Pharmadanica A/s (9.88%)
32.09%
Quarterly Results Snapshot (Consolidated) - Dec'25 - YoY

YoY Growth in quarter ended Dec 2025 is 3.92% vs -2.92% in Dec 2024

YoY Growth in quarter ended Dec 2025 is -36.89% vs 44.58% in Dec 2024
Half Yearly Results Snapshot (Consolidated) - Sep'25
Growth in half year ended Sep 2025 is 2.76% vs 2.70% in Sep 2024
Growth in half year ended Sep 2025 is 84.05% vs -59.23% in Sep 2024
Nine Monthly Results Snapshot (Consolidated) - Dec'25
YoY Growth in nine months ended Dec 2025 is 3.15% vs 0.72% in Dec 2024
YoY Growth in nine months ended Dec 2025 is 11.57% vs -28.43% in Dec 2024
Annual Results Snapshot (Consolidated) - Mar'25
YoY Growth in year ended Mar 2025 is -9.35% vs 27.29% in Mar 2024
YoY Growth in year ended Mar 2025 is -34.95% vs -26.35% in Mar 2024
About Medicamen Biotech Ltd

Company Coordinates


