
Compare Medico Intercon. with Similar Stocks
Dashboard
Weak Long Term Fundamental Strength with an average Return on Equity (ROE) of 10.42%
- Poor long term growth as Operating profit has grown by an annual rate of -175.50%
Flat results in Mar 26
Risky - Negative Operating Profits
Consistent Underperformance against the benchmark over the last 3 years
Stock DNA
Trading & Distributors
INR 26 Cr (Micro Cap)
NA (Loss Making)
22
0.00%
1.43
-6.82%
0.55
Total Returns (Price + Dividend) 
Latest dividend: 0.10085734364019677 per share ex-dividend date: Jun-23-2023
Risk Adjusted Returns v/s
Returns Beta

News

Medico Intercontinental Ltd is Rated Strong Sell
Medico Intercontinental Ltd is rated Strong Sell by MarketsMOJO. This rating was last updated on 14 August 2025, reflecting a shift from the previous 'Sell' grade. However, the analysis and financial metrics discussed here represent the stock's current position as of 10 July 2026, providing investors with the latest insights into the company’s performance and outlook.
Read full news article
Medico Intercontinental Ltd is Rated Strong Sell
Medico Intercontinental Ltd is rated Strong Sell by MarketsMOJO, with this rating last updated on 14 August 2025. However, the analysis and financial metrics discussed here reflect the stock’s current position as of 25 June 2026, providing investors with an up-to-date view of the company’s performance and outlook.
Read full news article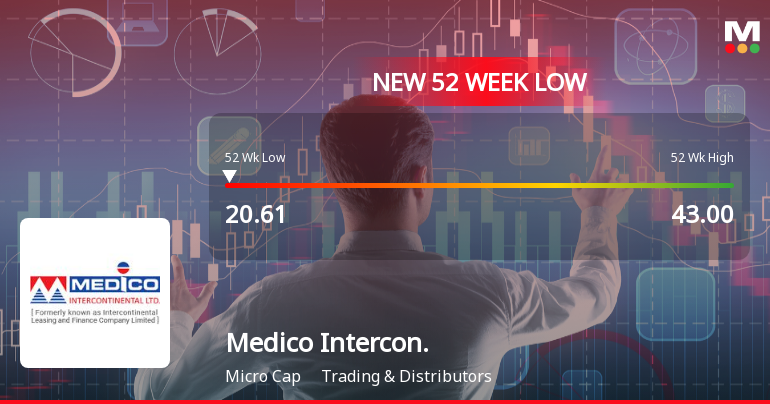
Medico Intercontinental Ltd Falls to 52-Week Low of Rs 20.61 as Sell-Off Deepens
For the fourth consecutive session, Medico Intercontinental Ltd has declined, culminating in a fresh 52-week low of Rs 20.61 on 2 Jun 2026. This marks a near 50% drop over the past year, significantly underperforming the broader Sensex, which itself is hovering close to its own 52-week low.
Read full news article Announcements
Compliances-Certificate under Reg. 74 (5) of SEBI (DP) Regulations 2018
09-Jul-2026 | Source : BSECertificate under Reg. 74(5) of SEBI (DP) Regulations 2018
Closure of Trading Window
29-Jun-2026 | Source : BSEClosure of Trading Windo
Updates - Submission Of Disclosure Under Regulation 7(2) Read With Regulation 6(2) Of SEBI (Prohibition Of Insider Trading) Regulations 2015
25-Jun-2026 | Source : BSESubmission of Disclosure
Corporate Actions

No Upcoming Board Meetings

Medico Intercontinental Ltd has declared 1% dividend, ex-date: 23 Jun 23

No Splits history available

No Bonus history available

No Rights history available
Quality key factors
Valuation key factors
Technicals key factors
 Technical Indicator Scale: Bearish, Mildly Bearish, Sideways, Mildly Bullish, Bullish Turned
 Shareholding Snapshot : Jun 2026
Shareholding Compare (%holding)
Promoters
None
Held by 0 Schemes
Held by 0 FIIs
Shah Samir (47.77%)
Lalita . (1.5%)
35.38%
Quarterly Results Snapshot (Consolidated) - Mar'26 - QoQ

QoQ Growth in quarter ended Mar 2026 is 13.30% vs -2.70% in Dec 2025

QoQ Growth in quarter ended Mar 2026 is -195.45% vs 86.67% in Dec 2025
Half Yearly Results Snapshot (Consolidated) - Sep'25
Growth in half year ended Sep 2025 is -25.09% vs 34.61% in Sep 2024
Growth in half year ended Sep 2025 is -185.66% vs 43.92% in Sep 2024
Nine Monthly Results Snapshot (Consolidated) - Dec'25
YoY Growth in nine months ended Dec 2025 is -16.94% vs 33.26% in Dec 2024
YoY Growth in nine months ended Dec 2025 is -165.55% vs 33.68% in Dec 2024
Annual Results Snapshot (Consolidated) - Mar'26
YoY Growth in year ended Mar 2026 is -11.79% vs 33.58% in Mar 2025
YoY Growth in year ended Mar 2026 is -163.24% vs 28.10% in Mar 2025
About Medico Intercontinental Ltd

Company Coordinates


