Mega Nirman

  • Market Cap: Micro Cap
  • Industry: Realty
  • ISIN: INE216Q01010
  • NSEID:
  • BSEID: 539767
INR
35.14
1.15 (3.38%)
BSENSE

Sep 01, 03:30 PM

BSE+NSE Vol: 3.24 k

  • Price Points
  • Score
  • Mojo Parameters
  • Total Return
  • News and Corporate Actions
  • Key factors
  • Shareholding
  • Financials
  • CompanyCV
stock-summaryPrice Point
High/Low

1Day

52 Week

Valuation
Technical
Day's Volume

CASH

3.24 k (-59.84%) Volume

Shareholding (Jun 2026)

FII

0.00%

Held by 0 FIIs

DII

0.00%

Held by 0 DIIs

Promoter

0.29%

Why is Mega Nirman & Industries Ltd falling/rising?

01-Sep-2026

As of 31-Aug, the stock price of Mega Nirman & Industries Ltd is at 33.99, showing a slight rise but has underperformed recently with a total decline of -4.57% over the last three days. Despite a positive annual return of +58.09%, it has faced significant challenges with a year-to-date decline of -26.11%, indicating ongoing difficulties.

As of 31-Aug, the stock price of Mega Nirman & Industries Ltd is experiencing a slight rise, currently at 33.99, with a change of 0.01 (0.03%) upwards. However, it is important to note that the stock has been underperforming recently, having fallen consecutively for the last three days with a total decline of -4.57% during this period. <BR><BR>In the broader context, while the stock has shown a positive return of +58.09% over the past year, it has also faced significant challenges, with a year-to-date decline of -26.11%. Comparatively, the Sensex has only decreased by -9.70% in the same timeframe. <BR><BR>Today's performance indicates that the stock has underperformed its sector by -1.31%. Additionally, there has been a decrease in investor participation, as evidenced by a -16.97% drop in delivery volume compared to the five-day average. This suggests a lack of strong buying interest, which could contribute to the stock's recent price movements.<BR><BR>Overall, while there is a minor uptick in the stock price today, the recent trends and performance metrics indicate ongoing challenges for Mega Nirman & Industries Ltd.

View full answer

Who are in the management team of Mega Nirman?

01-Sep-2026

The management team of Mega Nirman includes Chairperson Govind Swaroop Mishra, Executive Director Mohan Jagdish Aggarwal, Directors Anand Rai and Zabihullah Burhani, Independent Directors Monendra Srivastava, Sushma Jain, and Vinay Singh, Company Secretary Kanika, and Additional Director Ankan Gupta. This diverse team combines executive leadership with independent oversight.

The management team of Mega Nirman includes the following individuals:<BR><BR>1. **Govind Swaroop Mishra** - Chairperson<BR>2. **Mohan Jagdish Aggarwal** - Executive Director<BR>3. **Anand Rai** - Director<BR>4. **Zabihullah Burhani** - Director<BR>5. **Monendra Srivastava** - Independent Director<BR>6. **Sushma Jain** - Independent Director<BR>7. **Vinay Singh** - Independent Director<BR>8. **Kanika** - Company Secretary<BR>9. **Ankan Gupta** - Additional Director<BR><BR>This team brings a mix of independent directors, executive leadership, and company secretarial support to the organization.

View full answer

What does Mega Nirman do?

01-Sep-2026

Mega Nirman & Industries Ltd provides EV charging solutions and operates in the realty sector. As of June 2026, it reported net sales of 2 Cr and a market cap of INR 90 Cr.

Overview: <BR>Mega Nirman & Industries Ltd is involved in providing EV (Electric Vehicle) charging-based solutions and operates within the Realty industry as a micro-cap company.<BR><BR>History: <BR>The company was originally incorporated on March 23, 1983, under the name "Daphene Investment and Properties Limited" and later changed its name to "Mega Nirman & Industries Limited." The latest quarterly results reported net sales and net profit for June 2026.<BR><BR>Financial Snapshot: <BR>Most recent Net Sales: 2 Cr (Quarterly Results - Jun 2026) <BR>Most recent Net Profit: 0 Cr (Quarterly Results - Jun 2026) <BR>Market-cap value: INR 90 Cr (Micro Cap) <BR><BR>Key Metrics: <BR>P/E: 150.00 <BR>Industry P/E: 21 <BR>Dividend Yield: 0.00% <BR>Debt-Equity: 0.09 <BR>Return on Equity: 1.48% <BR>Price to Book: 2.33 <BR><BR>Contact Details: <BR>Address: A-6/343B 1st Floor, Paschim Vihar New Delhi New Delhi : 110063 <BR>Tel: 91-11-49879687 <BR>Email: secretarial.mnil@gmail.com <BR>Website: http://www.mnil.in

View full answer

Who are the peers of the Mega Nirman?

01-Sep-2026

Mega Nirman's peers include Shri Krishna, Dharan Infra-EPC, Victoria Mills, Shervani Indl Sy, Landmark Prop., Prerna Infra., Radhe Develop., and Garnet Construct. Victoria Mills shows the highest 1-year return at 39.36%, while Dharan Infra-EPC has the lowest at -59.57%, with Mega Nirman achieving a 1-year return of 58.09%.

Peers: The peers of Mega Nirman are Shri Krishna, Dharan Infra-EPC, Victoria Mills, Shervani Indl Sy, Landmark Prop., Prerna Infra., Radhe Develop., Garnet Construct, H D I L.<BR><BR>Quality Snapshot: Below Average management risk is observed at Shri Krishna, Dharan Infra-EPC, Landmark Prop., Prerna Infra., Garnet Construct, and the rest. Average management risk is found at Victoria Mills, Shervani Indl Sy, Radhe Develop., and H D I L. Good growth is noted at Victoria Mills and Landmark Prop., while Average growth is seen at Radhe Develop., and Below Average growth is present at Shri Krishna, Dharan Infra-EPC, Shervani Indl Sy, Prerna Infra., Garnet Construct, and the rest. Excellent capital structure is attributed to Mega Nirman and Garnet Construct, while Good capital structure is seen at Shervani Indl Sy, Prerna Infra., and the rest, and Below Average capital structure is noted at Shri Krishna, Dharan Infra-EPC, Landmark Prop., Radhe Develop., H D I L.<BR><BR>Return Snapshot: Victoria Mills has the highest 1-year return at 39.36%, while Dharan Infra-EPC has the lowest at -59.57%. Mega Nirman's own 1-year return of 58.09% is significantly higher than both. Additionally, the six-month return is negative for Dharan Infra-EPC, Shervani Indl Sy, Radhe Develop., H D I L, and Garnet Construct.

View full answer

How big is Mega Nirman?

01-Sep-2026

As of 31st August, Mega Nirman & Industries Ltd has a market capitalization of 90.00 Cr, with Net Sales of 16.54 Cr and a Net Profit of 0.57 Cr reported for the latest four quarters. Shareholder's Funds are 38.53 Cr and Total Assets amount to 43.36 Cr as of March 2026.

As of 31st August, Mega Nirman & Industries Ltd has a market capitalization of 90.00 Cr, categorized as a Micro Cap.<BR><BR>In the latest four quarters, the company reported Net Sales of 16.54 Cr and a Net Profit of 0.57 Cr.<BR><BR>The latest reporting period for the balance sheet is March 2026, with Shareholder's Funds amounting to 38.53 Cr and Total Assets of 43.36 Cr.

View full answer

Should I buy, sell or hold Mega Nirman & Industries Ltd?

13-Aug-2026

When is the next results date for Mega Nirman & Industries Ltd?

31-Jul-2026

The next results date for Mega Nirman & Industries Ltd is 11 August 2026.

The next results date for Mega Nirman & Industries Ltd is scheduled for 11 August 2026.

View full answer

Are Mega Nirman & Industries Ltd latest results good or bad?

26-May-2026

Mega Nirman & Industries Ltd's latest results show strong year-on-year revenue growth of 83.61% and improved operating margins, but a significant sequential revenue decline of 45.98% and low return metrics raise concerns about sustainability. Overall, the results are mixed, indicating potential challenges ahead for the company.

The latest results for Mega Nirman & Industries Ltd present a mixed picture. On one hand, the company achieved a significant year-on-year revenue growth of 83.61%, with net sales reaching ₹3.36 crores in Q4 FY26, compared to ₹1.83 crores in the same quarter last year. Additionally, the operating margin improved to 17.86%, marking the highest level in seven quarters, and the company returned to profitability with a net profit of ₹0.26 crores after experiencing losses in previous quarters.<BR><BR>However, there are notable concerns. The quarter saw a sharp sequential decline in revenue of 45.98% from the previous quarter, and net profit also fell by 27.78% QoQ. This volatility in revenue indicates potential operational challenges and raises questions about the sustainability of the business model. Furthermore, the company's return on equity (ROE) remains very low at 0.61%, and it has a concerning negative return on capital employed (ROCE) of -2.39%, suggesting that the company is not effectively generating returns on its investments.<BR><BR>Overall, while there are positive aspects such as revenue growth and improved margins, the significant revenue volatility and low return metrics suggest that the latest results may not be entirely favorable. Investors should weigh these factors carefully when assessing the company's performance.

View full answer

Is Mega Nirman overvalued or undervalued?

05-Dec-2025

As of December 4, 2025, Mega Nirman is considered very expensive and overvalued, with a significantly negative PE ratio of -581.17 and an EV to EBITDA of -86.08, despite outperforming the Sensex with a 67.93% year-to-date return.

As of 4 December 2025, the valuation grade for Mega Nirman has moved from risky to very expensive. The company is currently overvalued based on its financial metrics. Key ratios include a PE ratio of -581.17, an EV to EBITDA of -86.08, and a Price to Book Value of 2.30, which indicate significant financial distress and an inflated valuation compared to its peers.<BR><BR>In comparison to its industry peers, Mega Nirman stands out with a PE ratio that is drastically negative, while Bajaj Finance has a PE of 34.9 and Bajaj Finserv shows a PE of 33.78, both indicating a much healthier valuation. Additionally, the company's recent stock performance has outpaced the Sensex, with a year-to-date return of 67.93% compared to the Sensex's 9.12%, but this does not justify its current valuation level. Overall, Mega Nirman is overvalued in the current market context.

View full answer

How has been the historical performance of Mega Nirman?

01-Dec-2025

Mega Nirman reported significant growth in net sales, reaching 6.97 Cr in March 2025, up from 0.00 Cr in March 2024, and achieved a profit after tax of 0.05 Cr, recovering from a loss the previous year. However, the company faced challenges with total expenditures of 7.68 Cr and a decrease in total assets to 14.05 Cr.

Answer:<BR>The historical performance of Mega Nirman shows a significant increase in net sales, reaching 6.97 Cr in March 2025, compared to 0.00 Cr in March 2024 and 1.52 Cr in March 2023. Total operating income also rose to 6.97 Cr in March 2025 from 0.00 Cr in the previous year. However, the company faced total expenditures of 7.68 Cr in March 2025, leading to an operating profit (PBDIT) of -0.71 Cr, slightly improved from -0.75 Cr in March 2024. The profit before tax turned positive at 0.07 Cr in March 2025, contrasting with a loss of -0.53 Cr in March 2024. Consequently, profit after tax was 0.05 Cr in March 2025, recovering from a loss of -0.53 Cr the previous year. <BR><BR>In terms of assets and liabilities, total assets decreased to 14.05 Cr in March 2025 from 19.57 Cr in March 2024, while total liabilities also fell to 14.05 Cr from 19.57 Cr. The company's cash and cash equivalents stood at 2.52 Cr in March 2025, down from 8.19 Cr in March 2024. The book value per share adjusted slightly to 13.34 in March 2025 from 13.18 in March 2024. Overall, while Mega Nirman has shown improvement in sales and profitability metrics in March 2025, it continues to face challenges in managing expenses and maintaining asset levels.<BR><BR>Breakdown:<BR>Mega Nirman experienced a notable increase in net sales, achieving 6.97 Cr in March 2025, a significant rise from 0.00 Cr in March 2024 and 1.52 Cr in March 2023. Total operating income mirrored this growth, reaching 6.97 Cr in March 2025. Despite these gains, total expenditures surged to 7.68 Cr, resulting in an operating profit (PBDIT) of -0.71 Cr, which was an improvement from -0.75 Cr in the previous year. The profit before tax turned positive at 0.07 Cr in March 2025, a recovery from a loss of -0.53 Cr in March 2024, leading to a profit after tax of 0.05 Cr, compared to a loss of -0.53 Cr the prior year. On the balance sheet, total assets decreased to 14.05 Cr from 19.57 Cr, with total liabilities also declining to 14.05 Cr. Cash and cash equivalents fell to 2.52 Cr from 8.19 Cr, while the book value per share adjusted to 13.34 from 13.18. Overall, the company has shown improvement in sales and profitability, but it continues to face challenges in managing its expenditures and asset levels.

View full answer

Who are the top shareholders of the Mega Nirman?

17-Jul-2025

The top shareholders of Mega Nirman include promoter Yogesh Kumar Goyal with 2.24% and public shareholder Ruchira Goyal with 5.14%, while individual investors collectively hold 91.87%. There are no institutional holdings from mutual funds or foreign investors.

The top shareholders of Mega Nirman include Yogesh Kumar Goyal, who is the promoter with the highest holding at 2.24%. The highest public shareholder is Ruchira Goyal, holding 5.14%. Additionally, individual investors hold a significant majority at 91.87%. There are no institutional holdings from mutual funds or foreign institutional investors.

View full answer

What is the technical trend for Mega Nirman?

09-Jun-2025

As of May 26, 2025, Mega Nirman's trend has shifted to mildly bullish, supported by positive weekly MACD and KST indicators, although daily moving averages show a slight bearish stance, suggesting cautious optimism overall.

As of 26 May 2025, the technical trend for Mega Nirman has changed from sideways to mildly bullish. The weekly MACD and KST are both bullish, supporting a positive outlook. Bollinger Bands are also indicating bullish momentum on both weekly and monthly time frames. However, the daily moving averages are showing a mildly bearish stance, which tempers the overall bullish sentiment. The Dow Theory aligns with a mildly bullish perspective on both weekly and monthly charts. Despite the daily bearish signal, the overall strength of the bullish indicators suggests a cautious optimism in the current trend.

View full answer

Has Mega Nirman declared dividend?

06-Jun-2025

No Dividend History Available

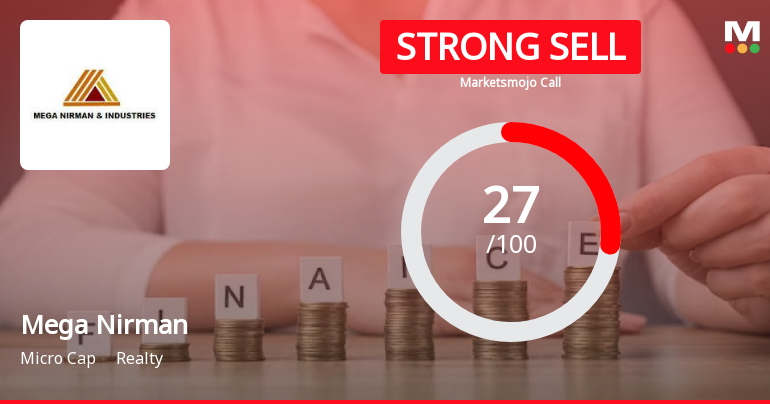
iScoreScore
Click here to find our call on this stock
Strong Sell
Sell
Hold
Buy
Strong Buy

Dashboard

1

With a Operating Losses, the company has a Weak Long Term Fundamental Strength

 
2

With ROE of 1.5, it has a Very Expensive valuation with a 2.3 Price to Book Value

stock-summaryMojo Parameters

Mojo Parameters

Loading Valuation Snapshot...

Stock DNA

stock-summary
Industry

Realty

stock-summary
Market cap

INR 96 Cr (Micro Cap)

stock-summary
P/E

156.00

stock-summary
Industry P/E

21

stock-summary
Dividend Yield

0.00%

stock-summary
Debt Equity

0.09

stock-summary
Return on Equity

1.48%

stock-summary
Price to Book

2.22

Revenue and Profits:
Net Sales:
2 Cr
(Quarterly Results - Jun 2026)
Net Profit:
0 Cr
stock-summaryTotal Returns
Total Returns (Price + Dividend) stock-summary
Dividend Yield (0%)
TimePeriod
Price Return
Dividend Return
Total Return
3 Months
-11.37%
0%
-11.37%
6 Months
-11.86%
0%
-11.86%
1 Year
71.16%
0%
71.16%
2 Years
84.85%
0%
84.85%
3 Years
154.45%
0%
154.45%
4 Years
71.41%
0%
71.41%
5 Years
151.9%
0%
151.9%

Mega Nirman for the last several years.

Risk Adjusted Returns v/s stock-summary
Returns Beta
Icon
Beta has not been calculated since enough price history is not available
stock-summaryNews & Corporate Actions

Announcements stock-summary

Shareholder Meeting / Postal Ballot-Scrutinizers Report

27-Aug-2026 | Source : BSE

Scrutnizer report and voting results under reg 44(3) of SEBI (LODR) 2015

Appointment Of M/S. Krishan Rakesh & Co. Chartered Accountants As Statutory Auditors For A Period Of 5 Consecutive Years.

27-Aug-2026 | Source : BSE

as per the pdf attached

Alteration Of The Articles Of Association Of The Company

27-Aug-2026 | Source : BSE

as per the pdf attached

Corporate Actions stock-summary

stock-summary
BOARD MEETING

No Upcoming Board Meetings

stock-summary
DIVIDEND

No Dividend history available

stock-summary
SPLITS

No Splits history available

stock-summary
BONUS

No Bonus history available

stock-summary
RIGHTS

No Rights history available

stock-summaryKey Factors

Quality key factors stock-summary

Factor
Value
Sales Growth (5y)
77.34%
EBIT Growth (5y)
11.84%
Net Debt to Equity (avg)
0.09
Institutional Holding
0
ROE (avg)
0.69%

Valuation key factors

Factor
Value
P/E Ratio
156
Industry P/E
21
Price to Book Value
2.31
EV to EBIT
-90.66
EV to EBITDA
90.66
EV to Capital Employed
2.25
EV to Sales
5.48
PEG Ratio
0.55
Dividend Yield
NA
ROCE (Latest)
-0.57%
ROE (Latest)
1.48%

Technicals key factors

Indicator
Weekly
Monthly
MACD
Bearish
Mildly Bearish
RSI
No Signal
No Signal
Bollinger Bands
Mildly Bearish
Bullish
Moving Averages
Mildly Bearish (Daily)
KST
Bearish
Bullish
Dow Theory
No Trend
No Trend
stock-summary Technical Indicator Scale: Bearish, Mildly Bearish, Sideways, Mildly Bullish, Bullish  Turned 
stock-summaryShareholding
Shareholding Snapshot : Jun 2026stock-summary
Shareholding Compare (%holding) stock-summary
Majority shareholders

Non Institution

Pledged Promoter Holdings

None

Mutual Funds

Held by 0 Schemes

FIIs

Held by 0 FIIs

Promoter with highest holding

Yogesh Kumar Goyal (0.29%)

Highest Public shareholder

M.d.s. Infrastructure Pvt. Ltd. (7.8%)

Individual Investors Holdings

46.11%

stock-summaryFinancial
[
  {
    "link": "quarterly",
    "btn_text": "All Quarterly Results",
    "header": "Quarterly Results Snapshot (Standalone) - Jun'26 - QoQ",
    "rhs": [
      {
        "prefix": "Net Sales ",
        "suffix": "QoQ Growth in quarter ended Jun 2026 is -28.57% vs -45.98% in Mar 2026",
        "dir": 1
      },
      {
        "prefix": "Standalone Net Profit ",
        "suffix": "QoQ Growth in quarter ended Jun 2026 is -88.46% vs -27.78% in Mar 2026",
        "dir": -1
      }
    ],
    "table": {
      "header": [
        "Jun'26",
        "Mar'26",
        "Change(%)"
      ],
      "body": [
        {
          "field": "Net Sales",
          "val1": "2.40",
          "val2": "3.36",
          "chgp": "-28.57%",
          "chgp_class": "negative"
        },
        {
          "field": "Operating Profit (PBDIT) excl Other Income",
          "val1": "-0.32",
          "val2": "0.60",
          "chgp": "-153.33%",
          "chgp_class": "negative"
        },
        {
          "field": "Interest",
          "val1": "0.01",
          "val2": "0.05",
          "chgp": "-80.00%",
          "chgp_class": "positive"
        },
        {
          "field": "Exceptional Items",
          "val1": "0.00",
          "val2": "0.00",
          "chgp": "",
          "chgp_class": "neutral"
        },
        {
          "field": "Standalone Net Profit",
          "val1": "0.03",
          "val2": "0.26",
          "chgp": "-88.46%",
          "chgp_class": "negative"
        },
        {
          "field": "Operating Profit Margin (Excl OI)",
          "val1": "-13.33%",
          "val2": "17.86%",
          "chgp": "-31.19%",
          "chgp_class": "negative"
        }
      ]
    }
  },
  {
    "link": "half-yearly",
    "btn_text": "All Half Yearly Results",
    "header": "Half Yearly Results Snapshot (Standalone) - Sep'25",
    "rhs": [
      {
        "prefix": "Net Sales ",
        "suffix": " Growth in half year ended Sep 2025 is 0.00% vs 0.00% in Sep 2024",
        "dir": 0
      },
      {
        "prefix": "Standalone Net Profit ",
        "suffix": " Growth in half year ended Sep 2025 is -237.50% vs 50.00% in Sep 2024",
        "dir": -1
      }
    ],
    "table": {
      "header": [
        "Sep'25",
        "Sep'24",
        "Change(%)"
      ],
      "body": [
        {
          "field": "Net Sales",
          "val1": "5.21",
          "val2": "0.00",
          "chgp": "",
          "chgp_class": "neutral"
        },
        {
          "field": "Operating Profit (PBDIT) excl Other Income",
          "val1": "-0.47",
          "val2": "-0.38",
          "chgp": "-23.68%",
          "chgp_class": "negative"
        },
        {
          "field": "Interest",
          "val1": "0.00",
          "val2": "0.00",
          "chgp": "",
          "chgp_class": "neutral"
        },
        {
          "field": "Exceptional Items",
          "val1": "0.00",
          "val2": "0.00",
          "chgp": "",
          "chgp_class": "neutral"
        },
        {
          "field": "Standalone Net Profit",
          "val1": "-0.27",
          "val2": "-0.08",
          "chgp": "-237.50%",
          "chgp_class": "negative"
        },
        {
          "field": "Operating Profit Margin (Excl OI)",
          "val1": "-9.02%",
          "val2": "0.00%",
          "chgp": "-9.02%",
          "chgp_class": "negative"
        }
      ]
    }
  },
  {
    "link": "nine-monthly",
    "btn_text": "All Nine Monthly Results",
    "header": "Nine Monthly Results Snapshot (Standalone) - Dec'25",
    "rhs": [
      {
        "prefix": "Net Sales ",
        "suffix": "YoY Growth in nine months ended Dec 2025 is 122.37% vs 0.00% in Dec 2024",
        "dir": 1
      },
      {
        "prefix": "Standalone Net Profit ",
        "suffix": "YoY Growth in nine months ended Dec 2025 is 200.00% vs 113.04% in Dec 2024",
        "dir": 1
      }
    ],
    "table": {
      "header": [
        "Dec'25",
        "Dec'24",
        "Change(%)"
      ],
      "body": [
        {
          "field": "Net Sales",
          "val1": "11.43",
          "val2": "5.14",
          "chgp": "122.37%",
          "chgp_class": "positive"
        },
        {
          "field": "Operating Profit (PBDIT) excl Other Income",
          "val1": "-0.51",
          "val2": "-0.42",
          "chgp": "-21.43%",
          "chgp_class": "negative"
        },
        {
          "field": "Interest",
          "val1": "0.00",
          "val2": "0.01",
          "chgp": "-100.00%",
          "chgp_class": "positive"
        },
        {
          "field": "Exceptional Items",
          "val1": "0.00",
          "val2": "0.00",
          "chgp": "",
          "chgp_class": "neutral"
        },
        {
          "field": "Standalone Net Profit",
          "val1": "0.09",
          "val2": "0.03",
          "chgp": "200.00%",
          "chgp_class": "positive"
        },
        {
          "field": "Operating Profit Margin (Excl OI)",
          "val1": "-4.46%",
          "val2": "-8.17%",
          "chgp": "3.71%",
          "chgp_class": "positive"
        }
      ]
    }
  },
  {
    "link": "annual",
    "btn_text": "All Annual Results",
    "header": "Annual Results Snapshot (Standalone) - Mar'26",
    "rhs": [
      {
        "prefix": "Net Sales ",
        "suffix": "YoY Growth in year ended Mar 2026 is 112.20% vs 0.00% in Mar 2025",
        "dir": 1
      },
      {
        "prefix": "Standalone Net Profit ",
        "suffix": "YoY Growth in year ended Mar 2026 is 600.00% vs 109.43% in Mar 2025",
        "dir": 1
      }
    ],
    "table": {
      "header": [
        "Mar'26",
        "Mar'25",
        "Change(%)"
      ],
      "body": [
        {
          "field": "Net Sales",
          "val1": "14.79",
          "val2": "6.97",
          "chgp": "112.20%",
          "chgp_class": "positive"
        },
        {
          "field": "Operating Profit (PBDIT) excl Other Income",
          "val1": "0.09",
          "val2": "-0.71",
          "chgp": "112.68%",
          "chgp_class": "positive"
        },
        {
          "field": "Interest",
          "val1": "0.06",
          "val2": "0.04",
          "chgp": "50.00%",
          "chgp_class": "negative"
        },
        {
          "field": "Exceptional Items",
          "val1": "0.00",
          "val2": "0.00",
          "chgp": "",
          "chgp_class": "neutral"
        },
        {
          "field": "Standalone Net Profit",
          "val1": "0.35",
          "val2": "0.05",
          "chgp": "600.00%",
          "chgp_class": "positive"
        },
        {
          "field": "Operating Profit Margin (Excl OI)",
          "val1": "0.61%",
          "val2": "-10.19%",
          "chgp": "10.80%",
          "chgp_class": "positive"
        }
      ]
    }
  }
]

Quarterly Results Snapshot (Standalone) - Jun'26 - QoQstock-summary

Jun'26
Mar'26
Change(%)
Net Sales
2.40
3.36
-28.57%
Operating Profit (PBDIT) excl Other Income
-0.32
0.60
-153.33%
Interest
0.01
0.05
-80.00%
Exceptional Items
0.00
0.00
Standalone Net Profit
0.03
0.26
-88.46%
Operating Profit Margin (Excl OI)
-13.33%
17.86%
-31.19%
Values in Rs Cr.
Direction Arrows
Net Sales

QoQ Growth in quarter ended Jun 2026 is -28.57% vs -45.98% in Mar 2026

Direction Arrows
Standalone Net Profit

QoQ Growth in quarter ended Jun 2026 is -88.46% vs -27.78% in Mar 2026

Half Yearly Results Snapshot (Standalone) - Sep'25stock-summary

Sep'25
Sep'24
Change(%)
Net Sales
5.21
0.00
Operating Profit (PBDIT) excl Other Income
-0.47
-0.38
-23.68%
Interest
0.00
0.00
Exceptional Items
0.00
0.00
Standalone Net Profit
-0.27
-0.08
-237.50%
Operating Profit Margin (Excl OI)
-9.02%
0.00%
-9.02%
Values in Rs Cr.
Net Sales

Growth in half year ended Sep 2025 is 0.00% vs 0.00% in Sep 2024

Direction Arrows
Standalone Net Profit

Growth in half year ended Sep 2025 is -237.50% vs 50.00% in Sep 2024

Nine Monthly Results Snapshot (Standalone) - Dec'25stock-summary

Dec'25
Dec'24
Change(%)
Net Sales
11.43
5.14
122.37%
Operating Profit (PBDIT) excl Other Income
-0.51
-0.42
-21.43%
Interest
0.00
0.01
-100.00%
Exceptional Items
0.00
0.00
Standalone Net Profit
0.09
0.03
200.00%
Operating Profit Margin (Excl OI)
-4.46%
-8.17%
3.71%
Values in Rs Cr.
Direction Arrows
Net Sales

YoY Growth in nine months ended Dec 2025 is 122.37% vs 0.00% in Dec 2024

Direction Arrows
Standalone Net Profit

YoY Growth in nine months ended Dec 2025 is 200.00% vs 113.04% in Dec 2024

Annual Results Snapshot (Standalone) - Mar'26stock-summary

Mar'26
Mar'25
Change(%)
Net Sales
14.79
6.97
112.20%
Operating Profit (PBDIT) excl Other Income
0.09
-0.71
112.68%
Interest
0.06
0.04
50.00%
Exceptional Items
0.00
0.00
Standalone Net Profit
0.35
0.05
600.00%
Operating Profit Margin (Excl OI)
0.61%
-10.19%
10.80%
Values in Rs Cr.
Direction Arrows
Net Sales

YoY Growth in year ended Mar 2026 is 112.20% vs 0.00% in Mar 2025

Direction Arrows
Standalone Net Profit

YoY Growth in year ended Mar 2026 is 600.00% vs 109.43% in Mar 2025

stock-summaryCompany CV
About Mega Nirman & Industries Ltd stock-summary
stock-summary
Mega Nirman & Industries Ltd
Micro Cap
Realty
Mega Nirman & Industries Limited was originally incorporated on March 23, 1983 with the name "Daphene Investment and Properties Limited", as a Public Limited Company. The Company changed its name from "Daphene Investment and Properties Limited" to "Mega Nirman & Industries Limited" and a fresh Certificate of Incorporation was issued by the Registrar of Companies. The Company is involved in the business of EV (Electric Vehicle) charging based solutions.
Company Coordinates stock-summary
Company Details
A-6/343B 1st Floor, Paschim Vihar New Delhi New Delhi : 110063
stock-summary
Tel: 91-11-49879687
stock-summary
secretarial.mnil@gmail.com
Registrar Details
Beetal Financial & Computer Services (P) Ltd , Beetal House , 99 Mandangir, 3rd Floor, Behind Local Shopping Centre, Near Dada Harsukhdas Mandir, New Delhi