
Compare Sigma Advanced S with Similar Stocks
Dashboard
Weak Long Term Fundamental Strength with a -280.80% CAGR growth in Operating Profits over the last 5 years
- Company's ability to service its debt is weak with a poor EBIT to Interest (avg) ratio of -1.90
- The company has reported losses. Due to this company has reported negative ROCE
Risky - Negative EBITDA
Stock DNA
Telecom - Services
INR 2,692 Cr (Micro Cap)
18.00
21
0.00%
-0.44
50.99%
9.17
Total Returns (Price + Dividend) 
Latest dividend: 1.2 per share ex-dividend date: Jun-10-2008
Risk Adjusted Returns v/s
Returns Beta

News
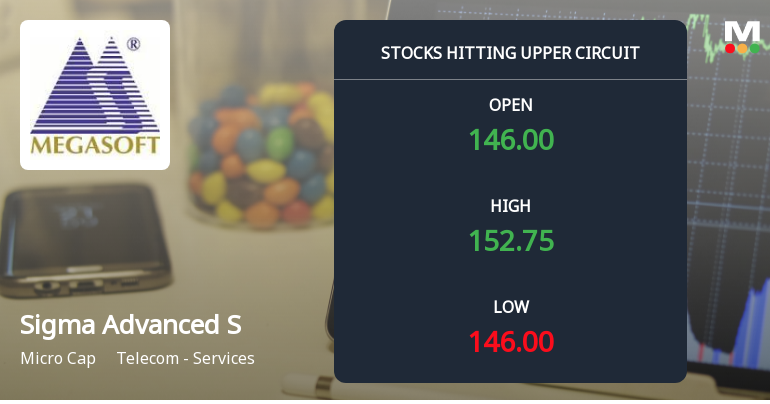
Sigma Advanced System Ltd Locks at Upper Circuit With 5% Gain — Buyers Queue, Sellers Absent
At Rs 154.89, the buying was done — not because demand dried up, but because the exchange wouldn't let the stock go any higher. Sigma Advanced System Ltd locked at its upper circuit of 5.0% on 1 Apr 2026, with buyers queuing and no sellers willing to part with shares.
Read full news article
Sigma Advanced System Ltd Locks at Lower Circuit With 4.94% Loss — Sellers Queue, No Buyers in Sight
At Rs 147.52, sellers were still queuing — but there were no buyers willing to take the other side. Sigma Advanced System Ltd locked at its lower circuit of 4.94% on 30 Mar 2026, with unfilled sell orders and a frozen price.
Read full news article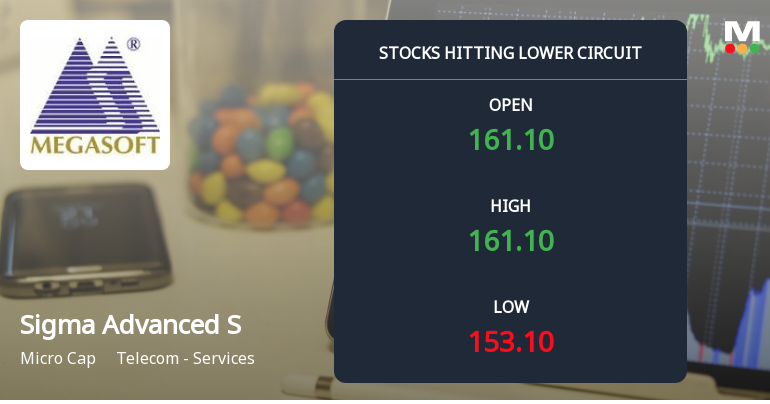
Sigma Advanced System Ltd Locks at Lower Circuit With 5.0% Loss — Sellers Queue, No Buyers in Sight
At Rs 155.28, sellers were still queuing — but there were no buyers willing to take the other side. Sigma Advanced System Ltd locked at its lower circuit of 5.0% on 27 Mar 2026, with unfilled sell orders and a frozen price.
Read full news article Announcements
Closure of Trading Window
26-Mar-2026 | Source : BSEIntimation of Closure of Trading Window
Shareholder Meeting / Postal Ballot-Outcome of Postal_Ballot
21-Mar-2026 | Source : BSERevised Disclosure of Voting Results under Regulation 44 (3) of LODR (Regulations) 2015 for the Postal Ballot Notice dated February 18 2026.
Shareholder Meeting / Postal Ballot-Scrutinizers Report
20-Mar-2026 | Source : BSEDisclosure of Voting Results Under Regulation 44 (3) of SEBI (LODR) Regulations 2015 and Scrutinizer Report on Remote E-Voting for the Postal Ballot Notice dated February 18 2026.
Corporate Actions

No Upcoming Board Meetings

Sigma Advanced System Ltd has declared 12% dividend, ex-date: 10 Jun 08

No Splits history available

No Bonus history available

Sigma Advanced System Ltd has announced 2:3 rights issue, ex-date: 12 Jul 21
Quality key factors
Valuation key factors
Technicals key factors
 Technical Indicator Scale: Bearish, Mildly Bearish, Sideways, Mildly Bullish, Bullish Turned
 Shareholding Snapshot : Jan 2026
Shareholding Compare (%holding)
Promoters
None
Held by 0 Schemes
Held by 9 FIIs (0.07%)
Chintalapati Holdings Private Limited (46.31%)
None
23.81%
Quarterly Results Snapshot (Consolidated) - Dec'25 - QoQ

QoQ Growth in quarter ended Dec 2025 is 702.75% vs 0.00% in Sep 2025

QoQ Growth in quarter ended Dec 2025 is -124.35% vs -96.89% in Sep 2025
Half Yearly Results Snapshot (Consolidated) - Sep'25
Growth in half year ended Sep 2025 is 0.00% vs 0.00% in Sep 2024
Growth in half year ended Sep 2025 is 540.69% vs -16,436.84% in Sep 2024
Nine Monthly Results Snapshot (Consolidated) - Dec'25
YoY Growth in nine months ended Dec 2025 is 667.25% vs 0.00% in Dec 2024
YoY Growth in nine months ended Dec 2025 is 672.10% vs -414.75% in Dec 2024
Annual Results Snapshot (Consolidated) - Mar'25
YoY Growth in year ended Mar 2025 is 0.00% vs -100.00% in Mar 2024
YoY Growth in year ended Mar 2025 is -9.65% vs -244.39% in Mar 2024
About Sigma Advanced System Ltd

Company Coordinates


