
Compare Megastar Foods with Similar Stocks
Dashboard
Healthy long term growth as Net Sales has grown by an annual rate of 30.16%
The company has declared Positive results for the last 4 consecutive quarters
With ROCE of 11.7, it has a Attractive valuation with a 2.3 Enterprise value to Capital Employed
Increasing Participation by Institutional Investors
Market Beating Performance
Total Returns (Price + Dividend) 
Megastar Foods for the last several years.
Risk Adjusted Returns v/s
Returns Beta

News
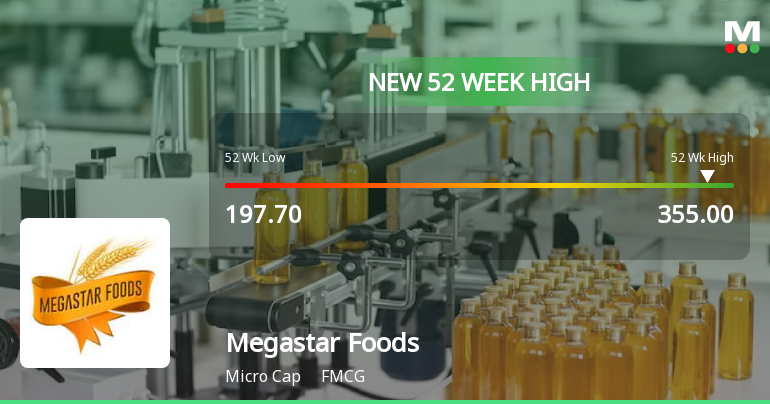
Broad-Based Technical Strength Lifts Megastar Foods Ltd to 52-Week High of Rs 355
With a decisive surge to Rs 355 on 24 Jun 2026, Megastar Foods Ltd has reached a fresh 52-week high, marking a significant milestone in its price momentum. This rally is underpinned by a confluence of bullish technical indicators and sustained market outperformance.
Read full news article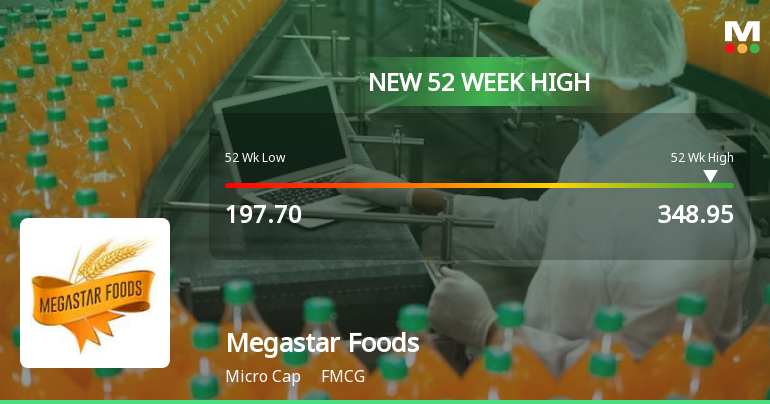
Broad-Based Technical Strength Lifts Megastar Foods Ltd to 52-Week High of Rs 348.95
With a decisive surge to Rs 348.95 on 23 Jun 2026, Megastar Foods Ltd has reached a new 52-week high, marking a significant milestone in its recent price momentum. This advance comes despite a broadly negative market backdrop, underscoring the stock’s robust technical underpinnings and sustained upward trajectory over the past year.
Read full news article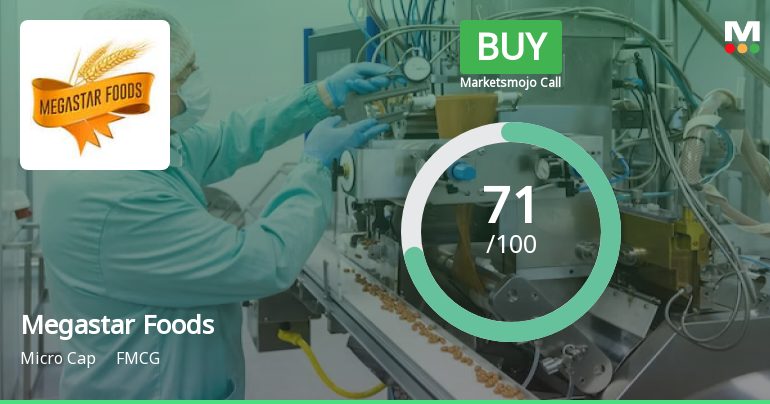
Megastar Foods Ltd is Rated Buy
Megastar Foods Ltd is rated 'Buy' by MarketsMOJO, with this rating last updated on 26 May 2026. However, the analysis and financial metrics discussed here reflect the stock's current position as of 22 June 2026, providing investors with the most up-to-date insight into the company’s performance and outlook.
Read full news article Announcements
Clarification Regarding Intimation Under Regulation 30 Of SEBI (Listing Obligations And Disclosure Requirements) Regulations 2015
16-Jun-2026 | Source : BSEClarification regarding intimation under Regulation 30 of SEBI (Listing Obligation and Disclosure Requirements) Regulation 2015
Disclosure Under Regulation 30 Of SEBI (Listing Obligations And Disclosure Requirements) Regulation 2015
15-Jun-2026 | Source : BSEDisclosure under Regulation 30 of SEBI (Listing Obligation and Disclosure Requirement) regulation 2015
Intimation Of Delegation Of Authority Under Regulation 30 (5) To Kmps To Determine Materiality Of Events
09-Jun-2026 | Source : BSEIntimation under Regulation 30 (5) of SEBI LODR Regulations regarding delegation of authority to determine materiality of events
Corporate Actions

No Upcoming Board Meetings

No Dividend history available

No Splits history available

No Bonus history available

No Rights history available
Quality key factors
Valuation key factors
Technicals key factors
 Technical Indicator Scale: Bearish, Mildly Bearish, Sideways, Mildly Bullish, Bullish Turned
 Shareholding Snapshot : Mar 2026
Shareholding Compare (%holding)
Promoters
None
Held by 0 Schemes
Held by 5 FIIs (1.72%)
Vikas Goel (22.96%)
Beeline Consultancy Services Private Limited (7.01%)
17.1%
Quarterly Results Snapshot (Consolidated) - Mar'26 - QoQ

QoQ Growth in quarter ended Mar 2026 is 3.43% vs 2.35% in Dec 2025

QoQ Growth in quarter ended Mar 2026 is -26.80% vs 28.57% in Dec 2025
Half Yearly Results Snapshot (Consolidated) - Sep'25
Growth in half year ended Sep 2025 is 73.12% vs 1.41% in Sep 2024
Growth in half year ended Sep 2025 is 102.58% vs -52.80% in Sep 2024
Nine Monthly Results Snapshot (Consolidated) - Dec'25
YoY Growth in nine months ended Dec 2025 is 64.90% vs 10.41% in Dec 2024
YoY Growth in nine months ended Dec 2025 is 192.47% vs -56.31% in Dec 2024
Annual Results Snapshot (Consolidated) - Mar'26
YoY Growth in year ended Mar 2026 is 47.52% vs 31.31% in Mar 2025
YoY Growth in year ended Mar 2026 is 145.38% vs -40.03% in Mar 2025
About Megastar Foods Ltd

Company Coordinates


