
Compare Meghna Infracon with Similar Stocks
Dashboard
Strong Long Term Fundamental Strength with an average Return on Equity (ROE) of 30.90%
Flat results in Mar 26
With ROE of 19.8, it has a Very Expensive valuation with a 59 Price to Book Value
Despite the size of the company, domestic mutual funds hold only 0% of the company
Consistent Returns over the last 3 years
Total Returns (Price + Dividend) 
Latest dividend: 0.1 per share ex-dividend date: Sep-13-2024
Risk Adjusted Returns v/s
Returns Beta

News

Meghna Infracon Infrastructure Ltd is Rated Hold
Meghna Infracon Infrastructure Ltd is rated 'Hold' by MarketsMOJO, with this rating last updated on 21 April 2026. While the rating change occurred on that date, the analysis and financial metrics discussed here reflect the stock’s current position as of 08 June 2026, providing investors with an up-to-date view of the company’s fundamentals, valuation, financial trends, and technical outlook.
Read full news article
Meghna Infracon Infrastructure Ltd is Rated Hold
Meghna Infracon Infrastructure Ltd is rated 'Hold' by MarketsMOJO, with this rating last updated on 21 April 2026. While the rating change occurred on that date, the analysis and financial metrics presented here reflect the stock's current position as of 08 June 2026, providing investors with an up-to-date view of the company’s performance and outlook.
Read full news article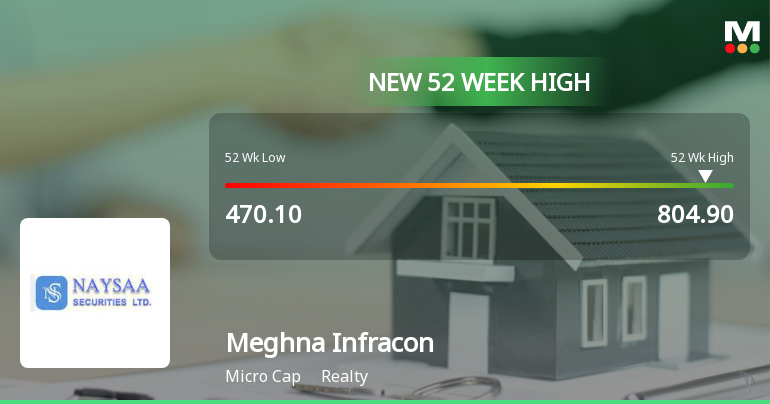
Broad-Based Technical Strength Lifts Meghna Infracon Infrastructure Ltd to 52-Week High of Rs 804.9
With a decisive surge to Rs 804.9 on 1 Jun 2026, Meghna Infracon Infrastructure Ltd has reached a fresh 52-week high, marking a 53.3% rally from its low of Rs 470.1 over the past year. This milestone is underscored by a strong alignment of technical indicators and sustained price momentum, setting the stock apart in the Realty sector despite broader market headwinds.
Read full news article Announcements
Board Meeting Outcome for Revised Outcome
05-Jun-2026 | Source : BSERevised outcome Submission of Revised Outcome along with Statement on Impact of Audit Qualifications for the Financial Year ended 31st March2026.
Announcement under Regulation 30 (LODR)-Earnings Call Transcript
02-Jun-2026 | Source : BSEPlease find enclosed the transcript of Q4 FY 26 Earning Conference Call held on 27th May2026.
Compliances-Reg.24(A)-Annual Secretarial Compliance
30-May-2026 | Source : BSECompliances-Reg.24(A)-Annual Secretarial
Corporate Actions

No Upcoming Board Meetings

Meghna Infracon Infrastructure Ltd has declared 1% dividend, ex-date: 13 Sep 24

No Splits history available

Meghna Infracon Infrastructure Ltd has announced 1:1 bonus issue, ex-date: 08 Jul 25

No Rights history available
Quality key factors
Valuation key factors
Technicals key factors
 Technical Indicator Scale: Bearish, Mildly Bearish, Sideways, Mildly Bullish, Bullish Turned
 Shareholding Snapshot : Mar 2026
Shareholding Compare (%holding)
Promoters
None
Held by 0 Schemes
Held by 8 FIIs (7.89%)
Vikram Jayantilal Lodha (26.55%)
Khushbu Arjunbhai Padhiyar (3.03%)
31.09%
Quarterly Results Snapshot (Consolidated) - Mar'26 - YoY

YoY Growth in quarter ended Mar 2026 is 52.48% vs 18.48% in Mar 2025

YoY Growth in quarter ended Mar 2026 is -48.98% vs 1,351.85% in Mar 2025
Half Yearly Results Snapshot (Standalone) - Sep'25
Growth in half year ended Sep 2025 is -77.06% vs -84.81% in Sep 2024
Growth in half year ended Sep 2025 is 27.75% vs -13.96% in Sep 2024
Nine Monthly Results Snapshot (Standalone) - Dec'25
YoY Growth in nine months ended Dec 2025 is -88.27% vs -75.38% in Dec 2024
YoY Growth in nine months ended Dec 2025 is -36.16% vs 102.67% in Dec 2024
Annual Results Snapshot (Consolidated) - Mar'26
YoY Growth in year ended Mar 2026 is 15.85% vs -25.49% in Mar 2025
YoY Growth in year ended Mar 2026 is -41.67% vs 520.13% in Mar 2025
About Meghna Infracon Infrastructure Ltd

Company Coordinates


