
Compare Megri Soft with Similar Stocks
Dashboard
Weak Long Term Fundamental Strength with an average Return on Equity (ROE) of 2.67%
- Poor long term growth as Net Sales has grown by an annual rate of 6.19% and Operating profit at 7.86% over the last 5 years
- Company's ability to service its debt is weak with a poor EBIT to Interest (avg) ratio of 0.66
Flat results in Mar 26
With ROE of 2.7, it has a Very Expensive valuation with a 1.1 Price to Book Value
Consistent Underperformance against the benchmark over the last 3 years
Stock DNA
Commercial Services & Supplies
INR 26 Cr (Micro Cap)
42.00
20
0.00%
-0.06
2.67%
1.12
Total Returns (Price + Dividend) 
Megri Soft for the last several years.
Risk Adjusted Returns v/s
Returns Beta

News
Are Megri Soft Ltd latest results good or bad?
Megri Soft Ltd's latest financial results for Q4 FY26 indicate a notable increase in both net sales and net profit compared to the previous quarter, with net sales reaching ₹0.92 crores, reflecting a year-on-year growth of 35.29%. The net profit for the quarter was ₹0.23 crores, which also shows a year-on-year increase of 64.29%. Additionally, the operating margin improved significantly to 36.96%, marking a substantial rise from the previous quarter. Despite these positive quarterly results, the company faces underlying challenges regarding its overall financial health. The average return on equity (ROE) remains low at 2.65%, indicating weak capital efficiency and raising concerns about the company's ability to generate meaningful returns for shareholders. Furthermore, while the recent quarterly performance shows improvements, Megri Soft has experienced considerable volatility in its financial results over...
Read full news article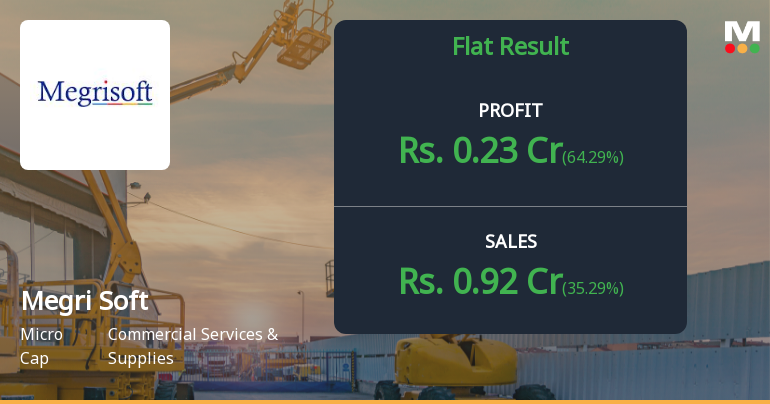
Megri Soft Q4 FY26: Profit Surge Masks Underlying Weaknesses in Micro-Cap IT Firm
Megri Soft Limited, a micro-cap IT services and consulting company with a market capitalisation of ₹26.00 crores, reported a consolidated net profit of ₹0.23 crores for Q4 FY26, marking a dramatic 155.56% quarter-on-quarter surge and a 64.29% year-on-year improvement. However, the impressive quarterly profit growth belies deeper concerns about the company's anaemic long-term profitability, expensive valuation, and deteriorating stock performance, which has plunged 37.98% over the past year whilst the stock trades at ₹82.48 following the results announcement.
Read full news article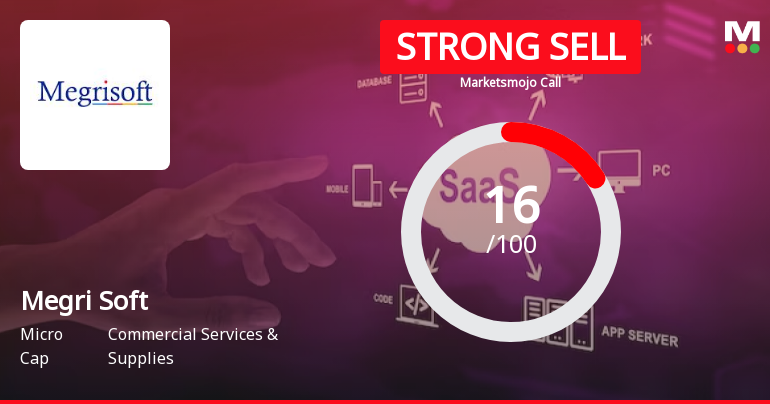
Megri Soft Ltd is Rated Strong Sell
Megri Soft Ltd is rated Strong Sell by MarketsMOJO, with this rating last updated on 07 Apr 2025. However, the analysis and financial metrics discussed here reflect the stock's current position as of 15 May 2026, providing investors with an up-to-date view of the company’s performance and outlook.
Read full news article Announcements
Announcement under Regulation 30 (LODR)-Newspaper Publication
22-May-2026 | Source : BSENewspaper publication - Special window for transfer and dematerialisation of physical shares
Audited Financial Results For The Quarter And Year Ended 31St March 2026
19-May-2026 | Source : BSEAudited Financial Results for the quarter and year ended 31st March 2026
Submission Of Half-Yearly Disclosure On Related Party Transactions Pursuant To Regulation 23(9) Of SEBI (Listing Obligations And Disclosure Requirements) Regulations 2015 As Amended
19-May-2026 | Source : BSEDisclosure on Related Party Transactions on a consolidated basis for the half year ended 31st March 2026
Corporate Actions

No Upcoming Board Meetings

No Dividend history available

No Splits history available

No Bonus history available

No Rights history available
Quality key factors
Valuation key factors
Technicals key factors
 Technical Indicator Scale: Bearish, Mildly Bearish, Sideways, Mildly Bullish, Bullish Turned
 Shareholding Snapshot : Mar 2026
Shareholding Compare (%holding)
Promoters
None
Held by 0 Schemes
Held by 0 FIIs
Mohnesh Kohli (37.19%)
Perth Technologies Private Limited (4.13%)
12.02%
Quarterly Results Snapshot (Consolidated) - Mar'26 - YoY

YoY Growth in quarter ended Mar 2026 is 35.29% vs -50.72% in Mar 2025
YoY Growth in quarter ended Mar 2026 is 64.29% vs -50.00% in Mar 2025
Half Yearly Results Snapshot (Consolidated) - Sep'25

Growth in half year ended Sep 2025 is -37.27% vs 100.00% in Sep 2024
Growth in half year ended Sep 2025 is 0.00% vs 38.10% in Sep 2024
Nine Monthly Results Snapshot (Consolidated) - Dec'25
YoY Growth in nine months ended Dec 2025 is -30.56% vs 44.00% in Dec 2024
YoY Growth in nine months ended Dec 2025 is -7.32% vs 0.00% in Dec 2024
Annual Results Snapshot (Consolidated) - Mar'26
YoY Growth in year ended Mar 2026 is -17.98% vs 5.33% in Mar 2025
YoY Growth in year ended Mar 2026 is 10.71% vs -17.65% in Mar 2025
About Megri Soft Ltd

Company Coordinates


