
Compare Meidensha Corp. with Similar Stocks
Stock DNA
Electronics & Appliances
JPY 263,604 Million (Small Cap)
12.00
NA
0.01%
-0.01
12.87%
1.92
Revenue and Profits:
Net Sales:
58,390 Million
(Quarterly Results - Jun 2025)
Net Profit:
474 Million
Total Returns (Price + Dividend) 
TimePeriod
Price Return
Dividend Return
Total Return
3 Months
39.81%
0%
39.81%
6 Months
51.52%
0%
51.52%
1 Year
45.08%
0%
45.08%
2 Years
215.37%
0%
215.37%
3 Years
188.68%
0%
188.68%
4 Years
159.79%
0%
159.79%
5 Years
227.3%
0%
227.3%
Meidensha Corp. for the last several years.
Risk Adjusted Returns v/s
News
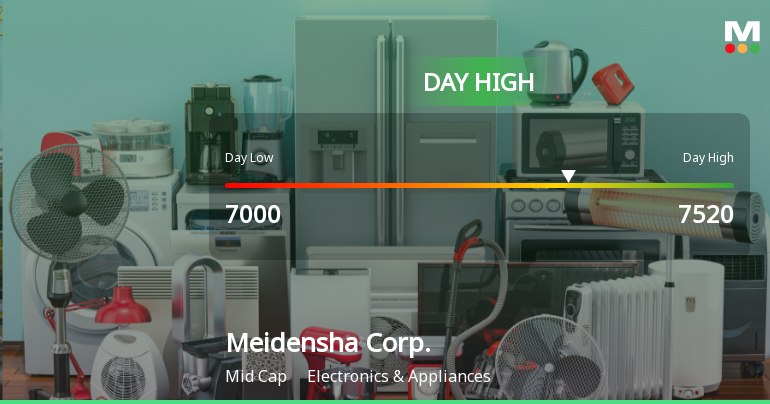
Meidensha Corp. Hits Day High with 11.7% Surge in Strong Performance
Meidensha Corp. has shown notable performance in the Electronics & Appliances sector, achieving significant gains both intraday and over the past month. The company maintains a strong financial position with a low Debt to EBITDA ratio and a solid return on capital employed, reflecting its resilience in the market.
Read full news article Announcements

No announcement available
Corporate Actions
No corporate action available
Quality key factors
Factor
Value
Sales Growth (5y)
3.32%
EBIT Growth (5y)
11.07%
EBIT to Interest (avg)
16.07
Debt to EBITDA (avg)
1.43
Net Debt to Equity (avg)
0.10
Sales to Capital Employed (avg)
1.70
Tax Ratio
20.81%
Dividend Payout Ratio
30.18%
Pledged Shares
0
Institutional Holding
0
ROCE (avg)
8.23%
ROE (avg)
8.98%
Valuation key factors
Factor
Value
P/E Ratio
12
Industry P/E
Price to Book Value
1.53
EV to EBIT
10.54
EV to EBITDA
6.94
EV to Capital Employed
1.49
EV to Sales
0.75
PEG Ratio
0.22
Dividend Yield
0.01%
ROCE (Latest)
14.09%
ROE (Latest)
13.14%
Technicals key factors
Indicator
Weekly
Monthly
MACD
Mildly Bearish
Bullish
RSI
No Signal
No Signal
Bollinger Bands
Mildly Bullish
Bullish
Moving Averages
Bullish (Daily)
KST
Mildly Bearish
Bullish
Dow Theory
Mildly Bullish
Mildly Bearish
OBV
Mildly Bullish
Mildly Bearish
 Technical Indicator Scale: Bearish, Mildly Bearish, Sideways, Mildly Bullish, Bullish Turned
 Shareholding Snapshot
No data for shareholding present.
Shareholding Compare (%holding)
No data for shareholding present.
Quarterly Results Snapshot (Consolidated) - Jun'25 - YoY
Jun'25
Jun'24
Change(%)
Net Sales
58,390.00
54,975.00
6.21%
Operating Profit (PBDIT) excl Other Income
3,001.00
1,835.00
63.54%
Interest
217.00
258.00
-15.89%
Exceptional Items
0.00
-58.00
100.00%
Consolidate Net Profit
474.00
1,045.00
-54.64%
Operating Profit Margin (Excl OI)
6.00%
-16.30%
2.23%
USD in Million.

Net Sales
YoY Growth in quarter ended Jun 2025 is 6.21% vs 2.70% in Jun 2024

Consolidated Net Profit
YoY Growth in quarter ended Jun 2025 is -54.64% vs 149.22% in Jun 2024
Annual Results Snapshot (Consolidated) - Mar'25
Mar'25
Mar'24
Change(%)
Net Sales
301,101.00
287,880.00
4.59%
Operating Profit (PBDIT) excl Other Income
32,674.00
23,741.00
37.63%
Interest
986.00
908.00
8.59%
Exceptional Items
747.00
-731.00
202.19%
Consolidate Net Profit
18,874.00
11,344.00
66.38%
Operating Profit Margin (Excl OI)
71.40%
44.20%
2.72%
USD in Million.
Net Sales
YoY Growth in year ended Mar 2025 is 4.59% vs 5.61% in Mar 2024
Consolidated Net Profit
YoY Growth in year ended Mar 2025 is 66.38% vs 56.25% in Mar 2024
About Meidensha Corp.

Meidensha Corp.
Electronics & Appliances
No Details Available.
Company Coordinates
No Company Details Available
InfinHub Market Technologies FZ-LLC, Building-2, Unit 112, Dubai Internet City, Dubai, United Arab Emirates
GET THE MARKETSMOJO APP


Company
Stocks
Portfolio


"Investment in securities markets are subject to market risk. Read all the related documents carefully before investing."