
Compare Menon Pistons with Similar Stocks
Dashboard
High Management Efficiency with a high ROE of 16.98%
Company has a Debt to Equity ratio (avg) of 0.06 times
Poor long term growth as Net Sales has grown by an annual rate of 6.55% and Operating profit at 0.43% over the last 5 years
Flat results in Mar 26
With ROE of 14.5, it has a Attractive valuation with a 1.9 Price to Book Value
Majority shareholders : Promoters
Market Beating Performance
Stock DNA
Auto Components & Equipments
INR 351 Cr (Micro Cap)
13.00
37
1.52%
-0.02
14.52%
1.89
Total Returns (Price + Dividend) 
Latest dividend: 1 per share ex-dividend date: Jul-22-2025
Risk Adjusted Returns v/s
Returns Beta

News
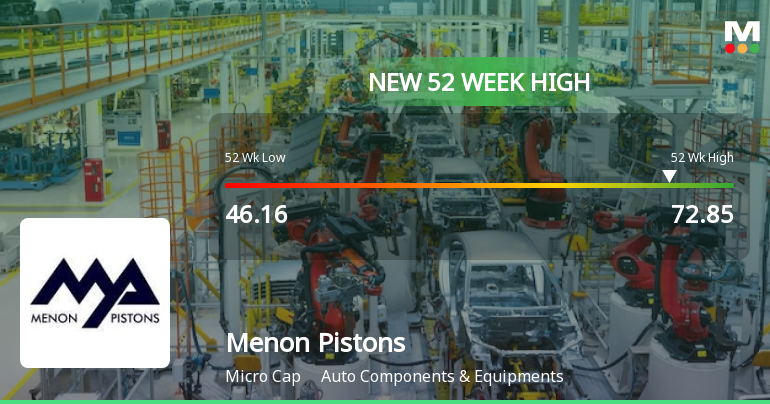
Broad-Based Technical Strength Lifts Menon Pistons Ltd to 52-Week High of Rs 72.85
With a fresh 52-week high of Rs 72.85 reached on 24 Jun 2026, Menon Pistons Ltd has demonstrated notable price momentum, outperforming the Sensex's negative 6.82% return over the past year with a 17.27% gain. This milestone reflects a sustained rally supported by a confluence of technical indicators signalling strength across multiple timeframes.
Read full news article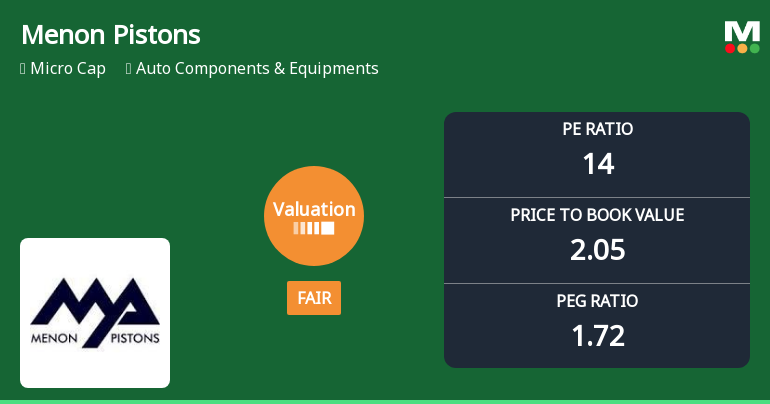
Menon Pistons Ltd Valuation Shifts Signal Renewed Investor Interest
Menon Pistons Ltd has witnessed a notable shift in its valuation parameters, moving from an attractive to a fair valuation grade, reflecting evolving investor sentiment amid robust price gains and improving fundamentals. This article analyses the recent changes in key valuation metrics such as price-to-earnings (P/E) and price-to-book value (P/BV) ratios, compares them with peer averages and historical benchmarks, and assesses the implications for investors in the auto components sector.
Read full news article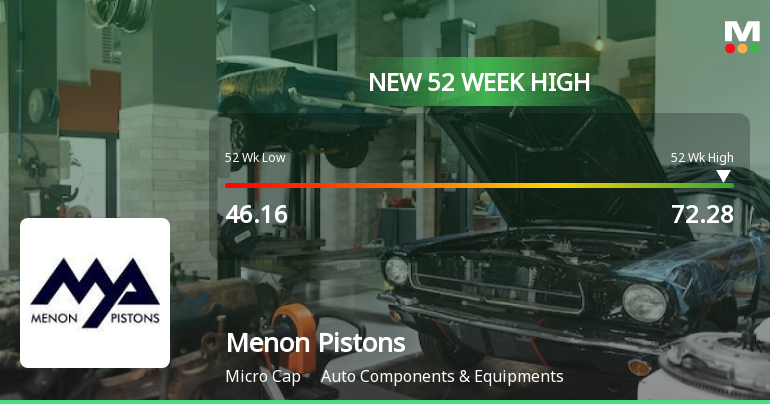
Broad-Based Technical Strength Lifts Menon Pistons Ltd to 52-Week High of Rs 72.28
With a decisive surge to Rs 72.28, Menon Pistons Ltd has reached a fresh 52-week high, marking a significant milestone in its price momentum. This rally comes amid a backdrop of strong technical signals and sustained gains over recent sessions, underscoring the stock’s robust upward trajectory.
Read full news article Announcements
Reply To Clarification Sought On Price Movement
25-Jun-2026 | Source : BSEReply to clarification sought on Price Movement dated 24.06.2026.
Clarification sought from Menon Pistons Ltd
24-Jun-2026 | Source : BSEThe Exchange has sought clarification from Menon Pistons Ltd on June 24 2026 with reference to significant movement in price in order to ensure that investors have latest relevant information about the company and to inform the market so that the interest of the investors is safeguarded.
The reply is awaited.
Announcement under Regulation 30 (LODR)-Change in Management
18-Jun-2026 | Source : BSE1. Approved the appointment of Ms. Nivedita Sachin Menon (DIN: 11771942) as an Additional Director (Executive Category) of the Company. 2. Approved the appointment of Mr. Gurudas Kamalakar Chorage (DIN: 06982157) as an Additional Director (non-Executive and Independent Category) of the Company. 3. Approve the appointment of CS Gayatri Eknath Patil (Membership No.: A80289) as a Company Secretary and Compliance Manager of the Company.
Corporate Actions

No Upcoming Board Meetings

Menon Pistons Ltd has declared 100% dividend, ex-date: 22 Jul 25

Menon Pistons Ltd has announced 1:10 stock split, ex-date: 20 Oct 16

No Bonus history available

No Rights history available
Quality key factors
Valuation key factors
Technicals key factors
 Technical Indicator Scale: Bearish, Mildly Bearish, Sideways, Mildly Bullish, Bullish Turned
 Shareholding Snapshot : Mar 2026
Shareholding Compare (%holding)
Promoters
None
Held by 0 Schemes
Held by 0 FIIs
Sachin Ram Menon (28.24%)
Vatsala Nair (1.16%)
22.87%
Quarterly Results Snapshot (Consolidated) - Mar'26 - QoQ

QoQ Growth in quarter ended Mar 2026 is -3.78% vs 2.09% in Dec 2025
QoQ Growth in quarter ended Mar 2026 is -30.95% vs -7.48% in Dec 2025
Half Yearly Results Snapshot (Consolidated) - Sep'25

Growth in half year ended Sep 2025 is 14.87% vs -1.09% in Sep 2024
Growth in half year ended Sep 2025 is 6.83% vs -7.34% in Sep 2024
Nine Monthly Results Snapshot (Consolidated) - Dec'25
YoY Growth in nine months ended Dec 2025 is 16.69% vs 1.23% in Dec 2024
YoY Growth in nine months ended Dec 2025 is 7.91% vs 1.98% in Dec 2024
Annual Results Snapshot (Consolidated) - Mar'26
YoY Growth in year ended Mar 2026 is 19.91% vs -0.76% in Mar 2025
YoY Growth in year ended Mar 2026 is 7.25% vs -9.83% in Mar 2025
About Menon Pistons Ltd

Company Coordinates


