
Compare MEP Infrast. with Similar Stocks
Dashboard
Weak Long Term Fundamental Strength as the company has not declared results in the last 6 months
- Poor long term growth as Net Sales has grown by an annual rate of -51.44% and Operating profit at 0% over the last 5 years
- The company has a negative book value of Rs 397.44 crore
The company has declared Negative results for the last 8 consecutive quarters
Risky - No result in last 6 months
75.71% of Promoter Shares are Pledged
Stock DNA
Transport Infrastructure
INR 9 Cr (Micro Cap)
NA (Loss Making)
36
0.00%
-0.95
60.78%
-0.02
Total Returns (Price + Dividend) 
Latest dividend: 0.3 per share ex-dividend date: Aug-29-2019
Risk Adjusted Returns v/s
Returns Beta

News

Micro-Cap MEP Infrastructure Developers Ltd Locks at Upper Circuit — Rs 0.52 Crore Turnover and Falling Delivery Highlight Thin Liquidity
At Rs 0.52, the buying was done — not because demand dried up, but because the exchange wouldn't let the stock go any higher. MEP Infrastructure Developers Ltd locked at its upper circuit of 2% on 31 Jul 2026, with buyers queuing and no sellers willing to part with shares in a session marked by limited liquidity and subdued delivery volumes.
Read full news article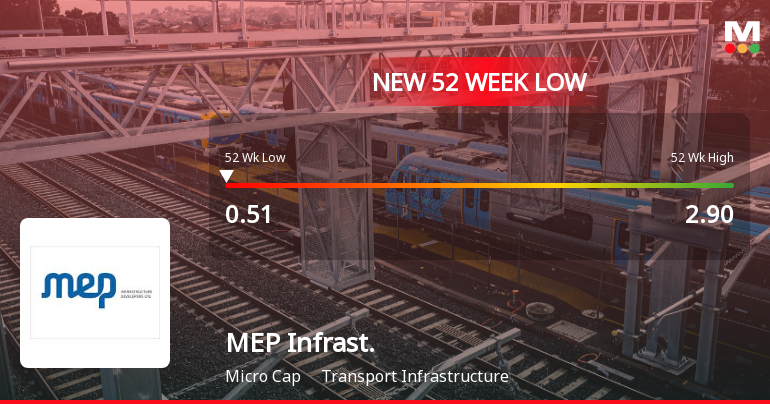
MEP Infrastructure Developers Ltd Falls to 52-Week Low of Rs 0.51 as Sell-Off Deepens
For the ninth consecutive session, MEP Infrastructure Developers Ltd has closed lower, culminating in a fresh 52-week low of Rs 0.51 on 31 Jul 2026. This extended decline has dragged the stock down by 15% over this period, sharply underperforming its sector and broader market indices.
Read full news article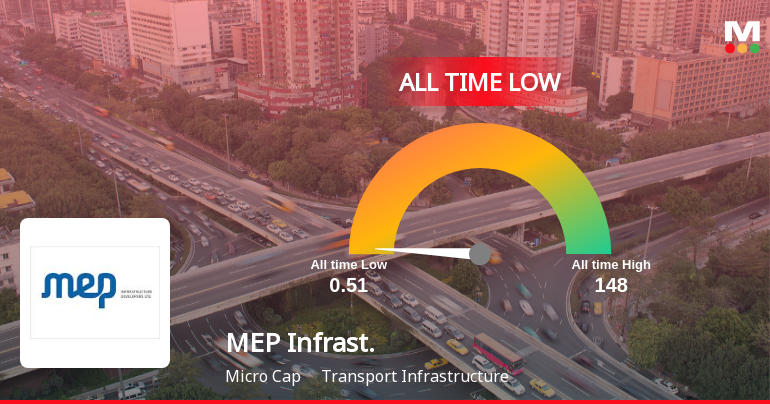
MEP Infrastructure Developers Ltd Extends Losing Streak to 9 Sessions, Touches All-Time Low
For the ninth consecutive session, MEP Infrastructure Developers Ltd has continued its downward trajectory, hitting a fresh all-time low of Rs.0.51 on 31 Jul 2026, underscoring a sustained period of price weakness amid broader market resilience.
Read full news article Announcements
Compliances-Certificate under Reg. 74 (5) of SEBI (DP) Regulations 2018
15-Jul-2026 | Source : BSECertificate under Reg 74(5) of Sebi (DP) Regulations 2018 for quarter ended June 30 2026.
Closure of Trading Window
25-Jun-2026 | Source : BSEIntimation of Closure of Trading Window for the 1st Quarter ended 30.06.2026
Corporate Insolvency Resolution Process (CIRP)-Updates - Corporate Insolvency Resolution Process (CIRP)
03-Jun-2026 | Source : BSEPost facto intimation of the 23rd Committee of Creditors meeting held on 2nd June 2026.
Corporate Actions

No Upcoming Board Meetings

MEP Infrastructure Developers Ltd has declared 3% dividend, ex-date: 29 Aug 19

No Splits history available

No Bonus history available

No Rights history available
Quality key factors
Valuation key factors
Technicals key factors
 Technical Indicator Scale: Bearish, Mildly Bearish, Sideways, Mildly Bullish, Bullish Turned
 Shareholding Snapshot : Jun 2026
Shareholding Compare (%holding)
Non Institution
75.706
Held by 1 Schemes (4.41%)
Held by 3 FIIs (0.12%)
A J Tolls Pvt Ltd (7.87%)
Hdfc Trustee Company Ltd A/c Hdfc Balance Advantage Fund (4.41%)
57.93%
Quarterly Results Snapshot (Standalone) - Mar'24 - QoQ

QoQ Growth in quarter ended Mar 2024 is 87.64% vs 275.26% in Dec 2023
QoQ Growth in quarter ended Mar 2024 is -551.69% vs -134.93% in Dec 2023
Half Yearly Results Snapshot (Consolidated) - Sep'23
Growth in half year ended Sep 2023 is -91.47% vs -53.16% in Sep 2022

Growth in half year ended Sep 2023 is 14.34% vs -134.02% in Sep 2022
Nine Monthly Results Snapshot (Consolidated) - Dec'23
YoY Growth in nine months ended Dec 2023 is -83.58% vs -68.12% in Dec 2022
YoY Growth in nine months ended Dec 2023 is -32.39% vs -169.48% in Dec 2022
Annual Results Snapshot (Standalone) - Mar'24
YoY Growth in year ended Mar 2024 is -15.24% vs -69.34% in Mar 2023
YoY Growth in year ended Mar 2024 is -476.33% vs -188.60% in Mar 2023
About MEP Infrastructure Developers Ltd

Company Coordinates


