
Compare Mercury EV-Tech with Similar Stocks
Dashboard
With a Operating Losses, the company has a Weak Long Term Fundamental Strength
- Low ability to service debt as the company has a high Debt to EBITDA ratio of 0.69 times
- The company has been able to generate a Return on Equity (avg) of 3.36% signifying low profitability per unit of shareholders funds
With a fall in Operating Profit of -1.66%, the company declared Very Negative results in Mar 26
With ROE of 3.1, it has a Very Expensive valuation with a 2.1 Price to Book Value
Below par performance in long term as well as near term
Total Returns (Price + Dividend) 
Mercury EV-Tech for the last several years.
Risk Adjusted Returns v/s
Returns Beta

News
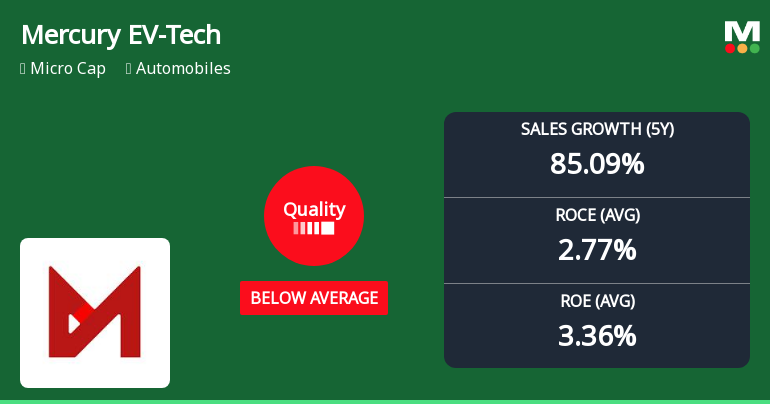
Mercury EV-Tech Ltd Downgraded to Below Average Quality Amid Weak Financial Metrics
Mercury EV-Tech Ltd, a micro-cap player in the automobile sector, has seen its quality grade downgraded from average to below average, reflecting deteriorating business fundamentals. Despite a robust sales growth over five years, key profitability and capital efficiency metrics have weakened, raising concerns about the company’s operational health and financial stability.
Read full news article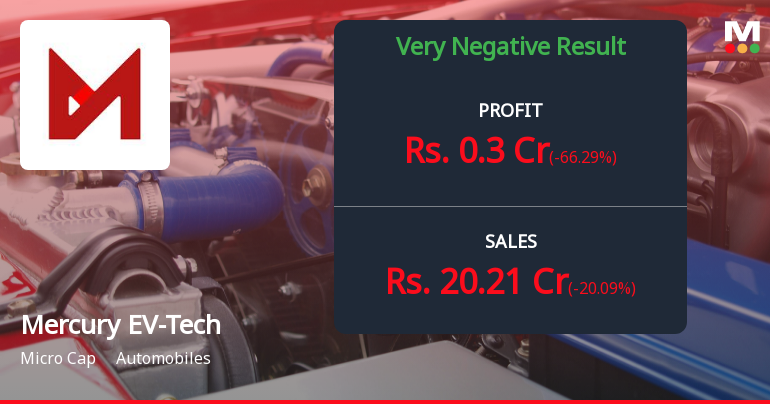
Mercury EV-Tech Q4 FY26: Profitability Collapse Amid Revenue Decline Raises Serious Concerns
Mercury EV-Tech Ltd., a micro-cap electric vehicle manufacturer with a market capitalisation of ₹633.00 crores, reported deeply concerning fourth-quarter results for FY26, with consolidated net profit plummeting 80.65% year-on-year to just ₹0.30 crores from ₹1.55 crores in the corresponding quarter last year. The quarter-on-quarter decline was equally alarming at 66.29%, down from ₹0.89 crores in Q3 FY26. The stock has reacted negatively to the deteriorating fundamentals, trading at ₹32.68 as of June 9, 2026, down 46.78% over the past year and significantly underperforming both the Sensex and the broader automobiles sector.
Read full news article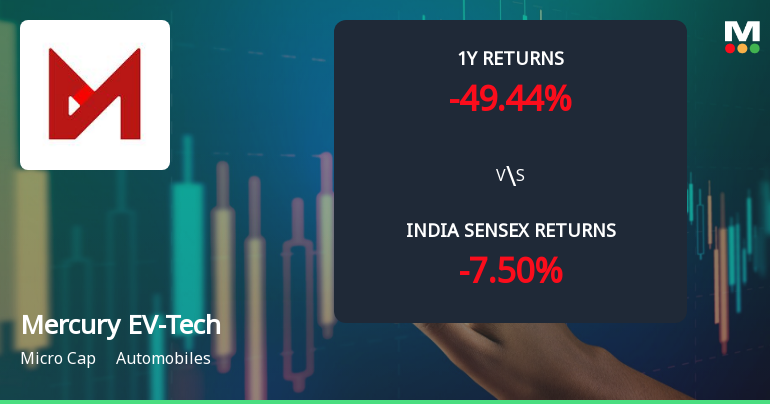
Mercury EV-Tech Ltd Technical Momentum Shifts Amid Mixed Market Signals
Mercury EV-Tech Ltd, a micro-cap player in the automobile sector, has exhibited a notable shift in its technical momentum, moving from a bearish stance to a mildly bearish trend. Despite a strong day gain of 4.98%, the stock’s broader technical indicators present a complex picture, with mixed signals from MACD, RSI, moving averages, and other momentum oscillators. This analysis delves into the recent technical parameter changes and their implications for investors navigating this volatile stock.
Read full news article Announcements
Intimation Of Listing Ceremony On NSE
03-Jun-2026 | Source : BSEIntimation of Listing Ceremony on NSE
Announcement under Regulation 30 (LODR)-Newspaper Publication
01-Jun-2026 | Source : BSEIntimation of Newspaper Advertisement
Board Meeting Outcome for Baord Meeting Outcome
31-May-2026 | Source : BSEBaord Meeting Outcome
Corporate Actions

No Upcoming Board Meetings

No Dividend history available

No Splits history available

No Bonus history available

Mercury EV-Tech Ltd has announced 23:1 rights issue, ex-date: 04 Aug 22
Quality key factors
Valuation key factors
Technicals key factors
 Technical Indicator Scale: Bearish, Mildly Bearish, Sideways, Mildly Bullish, Bullish Turned
 Shareholding Snapshot : May 2026
Shareholding Compare (%holding)
Promoters
None
Held by 0 Schemes
Held by 5 FIIs (1.7%)
Shree Saibaba Exim Private Limited (22.63%)
Forbes EMF (1.58%)
32.28%
Quarterly Results Snapshot (Consolidated) - Mar'26 - QoQ

QoQ Growth in quarter ended Mar 2026 is -20.09% vs -25.64% in Dec 2025

QoQ Growth in quarter ended Mar 2026 is -66.29% vs -48.26% in Dec 2025
Half Yearly Results Snapshot (Consolidated) - Sep'25
Growth in half year ended Sep 2025 is 142.27% vs 96.71% in Sep 2024
Growth in half year ended Sep 2025 is 43.75% vs 55.22% in Sep 2024
Nine Monthly Results Snapshot (Consolidated) - Dec'25
YoY Growth in nine months ended Dec 2025 is 38.86% vs 258.36% in Dec 2024
YoY Growth in nine months ended Dec 2025 is -38.99% vs 240.11% in Dec 2024
Annual Results Snapshot (Consolidated) - Mar'26
YoY Growth in year ended Mar 2026 is 13.88% vs 307.08% in Mar 2025
YoY Growth in year ended Mar 2026 is -44.12% vs 275.88% in Mar 2025
About Mercury EV-Tech Ltd

Company Coordinates


