Metal Coatings

  • Market Cap: Micro Cap
  • Industry: Iron & Steel Products
  • ISIN: INE161E01014
  • NSEID:
  • BSEID: 531810
INR
51.98
0.00 (0.00%)
BSENSE

Aug 26, 03:30 PM

BSE+NSE Vol: 110

  • Price Points
  • Score
  • Mojo Parameters
  • Total Return
  • News and Corporate Actions
  • Key factors
  • Shareholding
  • Financials
  • CompanyCV
stock-summaryPrice Point
High/Low

1Day

52 Week

Valuation
Technical
Day's Volume

CASH

110 (-76.44%) Volume

Shareholding (Jun 2026)

FII

0.00%

Held by 0 FIIs

DII

0.00%

Held by 0 DIIs

Promoter

70.94%

Why is Metal Coatings (India) Ltd falling/rising?

27-Aug-2026

As of 26-Aug, Metal Coatings (India) Ltd's stock price is Rs 51.98, down 1.92%, and has underperformed the Sensex, which gained 0.73%. The stock is in a bearish trend, trading below all key moving averages, with a year-to-date decline of 24.09%.

As of 26-Aug, Metal Coatings (India) Ltd is experiencing a decline in its stock price, currently at Rs 51.98, which reflects a change of -1.02 (-1.92%). The stock has underperformed compared to the benchmark Sensex, which has gained 0.73% over the past week while Metal Coatings has dropped by 3.56%. Over the last two days, the stock has seen a consecutive fall, totaling a decline of 5.89%. <BR><BR>Additionally, the stock is trading below its 5-day, 20-day, 50-day, 100-day, and 200-day moving averages, indicating a bearish trend. The intraday low reached Rs 51.13, marking a decrease of 3.53%. Despite a rise in investor participation, with delivery volume increasing by 88.21% against the 5-day average, the overall performance remains weak, as evidenced by the stock's year-to-date decline of 24.09% compared to a 9.09% drop in the Sensex. These factors collectively contribute to the current downward movement in the stock price of Metal Coatings (India) Ltd.

View full answer

Should I buy, sell or hold Metal Coatings (India) Ltd?

15-Aug-2026

Who are in the management team of Metal Coatings?

14-Aug-2026

The management team of Metal Coatings includes R C Khandelwal (Chairman & Wholetime Director), Pramod Khandelwal (Managing Director), S K Gupta, Neha Gupta, and Santosh Khandelwal (Independent Directors), along with Piyush Jain, Aditi Singh, and Vidushi Srivastava (Company Secretaries & Compliance Officers). They oversee operations and ensure regulatory compliance.

The management team of Metal Coatings includes the following individuals:<BR><BR>1. **R C Khandelwal** - Chairman & Wholetime Director<BR>2. **Pramod Khandelwal** - Managing Director<BR>3. **S K Gupta** - Independent Director<BR>4. **Neha Gupta** - Independent Director<BR>5. **Santosh Khandelwal** - Independent Director<BR>6. **Piyush Jain** - Company Secretary<BR>7. **Aditi Singh** - Company Secretary & Compliance Officer<BR>8. **Vidushi Srivastava** - Company Secretary & Compliance Officer<BR><BR>This team is responsible for overseeing the company's operations and ensuring compliance with regulatory requirements.

View full answer

What does Metal Coatings do?

14-Aug-2026

Metal Coatings (India) Ltd manufactures and markets steel products, classified as a Micro Cap company with a market cap of INR 40 Cr. As of June 2026, it reported net sales of 38 Cr and a net profit of 1 Cr.

Overview: <BR>Metal Coatings (India) Ltd is engaged in the manufacture and marketing of various steel products, operating within the Iron & Steel Products industry and classified as a Micro Cap company.<BR><BR>History: <BR>The company was incorporated in December 1994 to take over the assets and liabilities of a partnership firm established in 1988. It commenced operations in March 1995. The latest quarterly results reported net sales and net profit for June 2026.<BR><BR>Financial Snapshot: <BR>- Net Sales: 38 Cr (Quarterly Results - Jun 2026) <BR>- Net Profit: 1 Cr (Quarterly Results - Jun 2026) <BR>- Market Cap: INR 40 Cr (Micro Cap) <BR><BR>Key Metrics: <BR>- P/E: 16.00 <BR>- Industry P/E: 24 <BR>- Dividend Yield: 0.00% <BR>- Debt Equity: -0.14 <BR>- Return on Equity: 5.46% <BR>- Price to Book: 0.88 <BR><BR>Contact Details: <BR>Address: 912 Hemkunt Chambers, 89 Nehru Place New Delhi New Delhi : 110019 <BR>Tel: 91-011-41808125 <BR>Email: info@mcilindia.net <BR>Website: http://www.mcil.net

View full answer

Who are the peers of the Metal Coatings?

14-Aug-2026

Peers of Metal Coatings include Nova Iron & Steel, Dhatre Udyog, Umiya Tubes, Rathi Bars, Ashirwad Steels, Newmalayalam St., and Swastik Pipe. Metal Coatings has an average management risk and a 1-year return of -22.91%, better than Dhatre Udyog's -48.11% but worse than Ashirwad Steels' -23.37%.

Peers: The peers of Metal Coatings are Nova Iron &Steel, Dhatre Udyog, Umiya Tubes, Rathi Bars, Ashirwad Steels, Newmalayalam St., and Swastik Pipe.<BR><BR>Quality Snapshot: Below Average management risk is observed at Dhatre Udyog, Umiya Tubes, Rathi Bars, and Swastik Pipe, while Average management risk is found at Metal Coatings and Ashirwad Steels. Growth is Below Average for Dhatre Udyog, Umiya Tubes, Rathi Bars, Ashirwad Steels, and the rest. Capital Structure is Good at Metal Coatings and Newmalayalam St., while it is Below Average for Nova Iron &Steel, Dhatre Udyog, Umiya Tubes, Rathi Bars, Ashirwad Steels, Swastik Pipe.<BR><BR>Return Snapshot: The peer with the highest 1-year return is Ashirwad Steels at -23.37%, while Dhatre Udyog has the lowest at -48.11%. Metal Coatings has a 1-year return of -22.91%, which is better than Dhatre Udyog but worse than Ashirwad Steels. Additionally, all peers except Ashirwad Steels and Newmalayalam St. have negative six-month returns.

View full answer

How big is Metal Coatings?

14-Aug-2026

As of 14th August, Metal Coatings (India) Ltd has a market capitalization of 38.00 Cr, with recent net sales of 152.20 Cr and a net profit of 2.56 Cr. Shareholder's funds are 43.97 Cr, and total assets are 55.26 Cr.

As of 14th August, Metal Coatings (India) Ltd has a market capitalization of 38.00 Cr, categorizing it as a Micro Cap company.<BR><BR>In the latest four quarters, the company reported Net Sales of 152.20 Cr and a Net Profit of 2.56 Cr.<BR><BR>For the latest annual period ending in March 2026, Shareholder's Funds amounted to 43.97 Cr, while Total Assets were reported at 55.26 Cr.

View full answer

Are Metal Coatings (India) Ltd latest results good or bad?

28-May-2026

Metal Coatings (India) Ltd's latest results are concerning, showing an 86.47% decline in net profit to ₹0.13 crore and a 3.85% drop in revenue to ₹36.75 crore, marking a second consecutive quarter of decline. The company's operating margins have fallen to 1.33%, indicating significant financial challenges and a troubling outlook.

The latest results for Metal Coatings (India) Ltd are concerning. In Q4 FY26, the company reported a net profit of ₹0.13 crore, which is a drastic decline of 86.47% compared to the previous quarter. Revenue also fell by 3.85% to ₹36.75 crore, marking the second consecutive quarter of revenue decline. <BR><BR>Operating margins have collapsed to 1.33%, the lowest level in seven quarters, down from 2.83% in Q3 FY26. This significant margin compression, coupled with a year-on-year net profit decline of 90.23% from ₹1.33 crore in Q4 FY25, paints a troubling picture of the company’s financial health.<BR><BR>Overall, the results indicate a profitability crisis, with weak return ratios and limited institutional interest, suggesting that the company is struggling to maintain its operational performance. The combination of declining revenues, shrinking margins, and a lack of investor confidence points to a challenging outlook for Metal Coatings.

View full answer

When is the next results date for Metal Coatings (India) Ltd?

22-May-2026

The next results date for Metal Coatings (India) Ltd is 27 May 2026.

The next results date for Metal Coatings (India) Ltd is scheduled for 27 May 2026.

View full answer

Is Metal Coatings overvalued or undervalued?

04-Dec-2025

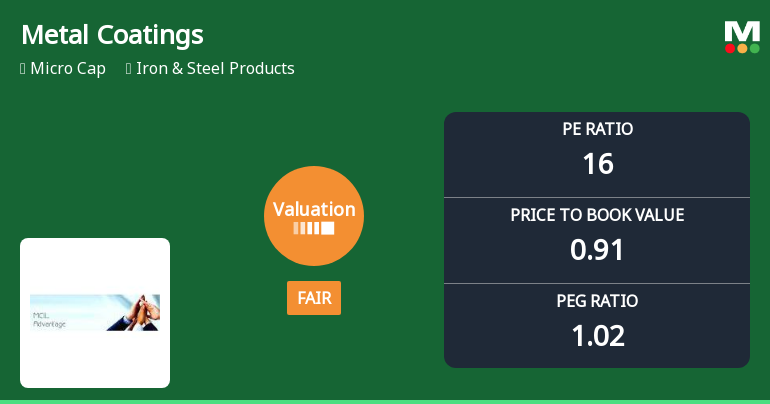
As of December 3, 2025, Metal Coatings is fairly valued with a PE ratio of 23.41, an EV to EBITDA of 7.88, and a Price to Book Value of 1.16, indicating it is neither undervalued nor overvalued compared to peers like JSW Steel and Tata Steel, despite underperforming against the Sensex with a return of -22.07%.

As of 3 December 2025, the valuation grade for Metal Coatings has moved from expensive to fair, indicating a more favorable assessment of its market position. The company is currently fairly valued, with a PE ratio of 23.41, an EV to EBITDA of 7.88, and a Price to Book Value of 1.16. These ratios suggest that while the company is not undervalued, it also does not appear to be overvalued relative to its peers.<BR><BR>In comparison to its industry peers, Metal Coatings' PE ratio is significantly lower than that of JSW Steel at 45.69 and Tata Steel at 27.99, both of which are considered attractive. Additionally, its EV to EBITDA ratio is more competitive than that of Lloyds Metals, which is rated very expensive at 26.84. Notably, Metal Coatings has underperformed against the Sensex over the past year, with a return of -22.07% compared to the Sensex's 5.27%, reinforcing its current fair valuation status.

View full answer

How has been the historical performance of Metal Coatings?

17-Nov-2025

Metal Coatings experienced fluctuating financial performance, with net sales declining to 160.25 Cr in March 2025 from 168.41 Cr in March 2024, but improved operational efficiency led to an increase in operating profit to 6.06 Cr. Despite challenges in sales and profit margins, the company showed resilience through cost management and improved cash flow, reaching 5.00 Cr from operating activities.

Answer:<BR>The historical performance of Metal Coatings shows a fluctuating trend in key financial metrics over the years leading up to March 2025.<BR><BR>Breakdown:<BR>Metal Coatings reported net sales of 160.25 Cr in March 2025, a decline from 168.41 Cr in March 2024 and 170.40 Cr in March 2023, but an increase from 142.26 Cr in March 2022 and 94.12 Cr in March 2021. The total operating income mirrored this trend, reaching 160.25 Cr in March 2025. The raw material costs were 130.26 Cr in March 2025, down from 141.39 Cr in March 2024, while total expenditure (excluding depreciation) was 154.94 Cr, a decrease from 165.18 Cr in March 2024. Operating profit (PBDIT) increased to 6.06 Cr in March 2025 from 3.74 Cr in March 2024, indicating improved operational efficiency. Profit before tax was 3.08 Cr in March 2025, slightly down from 3.20 Cr in March 2024, and profit after tax was 2.37 Cr, a decrease from 2.50 Cr in the previous year. The company maintained a consistent equity capital of 7.33 Cr over the years, while total reserves grew to 34.84 Cr in March 2025 from 32.31 Cr in March 2024. The book value per share increased to 57.56 in March 2025 from 54.09 in March 2024. Cash flow from operating activities improved to 5.00 Cr in March 2025, up from 2.00 Cr in March 2024, reflecting a positive cash generation trend. Overall, while Metal Coatings faced challenges in sales and profit margins, it demonstrated resilience in managing costs and improving cash flow.

View full answer

Who are the top shareholders of the Metal Coatings?

17-Jul-2025

The top shareholders of Metal Coatings include Khandelwal Galva Strips Private Limited with 23.82%, followed by Bondwell Financial Services (P) Ltd at 2.59%, while individual investors own 15.3%. There are currently no mutual funds or foreign institutional investors holding shares in the company.

The top shareholders of Metal Coatings are primarily the promoters, with Khandelwal Galva Strips Private Limited holding the largest stake at 23.82%. Additionally, the highest public shareholder is Bondwell Financial Services (P) Ltd, which holds 2.59%. Individual investors collectively own 15.3% of the company. Notably, there are no mutual funds or foreign institutional investors currently holding shares in Metal Coatings.

View full answer

What is the technical trend for Metal Coatings?

09-Jun-2025

As of June 5, 2025, the technical trend for Metal Coatings is bearish with moderate strength, supported by bearish indicators across multiple time frames, despite some mixed signals in momentum.

As of 5 June 2025, the technical trend for Metal Coatings has changed from mildly bearish to bearish. The current stance is bearish with moderate strength. The weekly MACD is mildly bullish, but the monthly MACD and KST are both bearish, indicating weakness in the longer-term trend. The RSI shows no signal on the weekly chart while being bullish on the monthly, suggesting mixed momentum. Bollinger Bands are bearish on both weekly and monthly time frames, and moving averages are bearish on the daily chart. Overall, the indicators suggest a prevailing bearish sentiment in the market for Metal Coatings.

View full answer

Has Metal Coatings declared dividend?

06-Jun-2025

Metal Coatings (India) Ltd has declared a 5% dividend, amounting to 0.5 per share, but the dividend yield is 0%. Total returns have varied significantly, with strong performance over the long term despite negative returns in shorter periods.

Metal Coatings (India) Ltd has declared a 5% dividend.<BR><BR>Dividend Details:<BR>- Percentage announced: 5%<BR>- Amount per share: 0.5<BR>- Ex-date: 16 Sep 19<BR><BR>Dividend Yield: 0%<BR><BR>Total Returns by Period:<BR>In the 6-month period, the price return was -17.62%, the dividend return was 0%, resulting in a total return of -17.62%.<BR><BR>For the 1-year period, the price return was -13.36%, the dividend return was 0%, leading to a total return of -13.36%.<BR><BR>Over the 2-year period, the price return was -29.51%, the dividend return was 0%, which resulted in a total return of -29.51%.<BR><BR>In the 3-year period, the price return was 4.43%, the dividend return was 0%, culminating in a total return of 4.43%.<BR><BR>During the 4-year period, the price return was 126.46%, the dividend return was 0%, yielding a total return of 126.46%.<BR><BR>For the 5-year period, the price return was 153.62%, the dividend return was 0%, resulting in a total return of 153.62%.<BR><BR>Overall, while Metal Coatings has declared a dividend, the dividend yield remains at 0%, indicating that the dividend did not contribute to returns in recent periods. The total returns show significant variability, with strong performance over the longer term despite negative returns in the shorter periods.

View full answer
iScoreScore
Click here to find our call on this stock
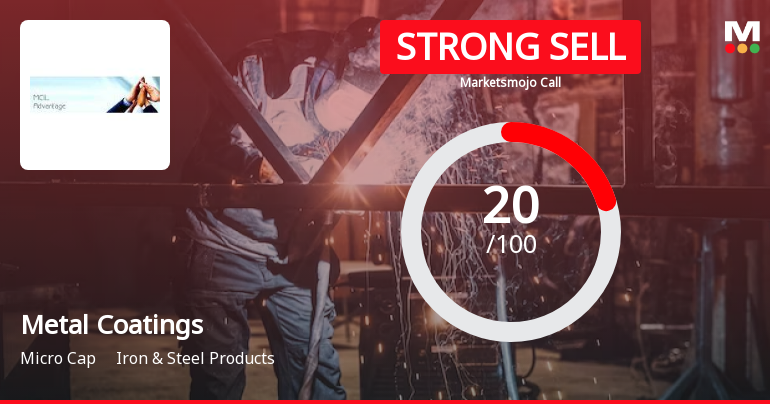
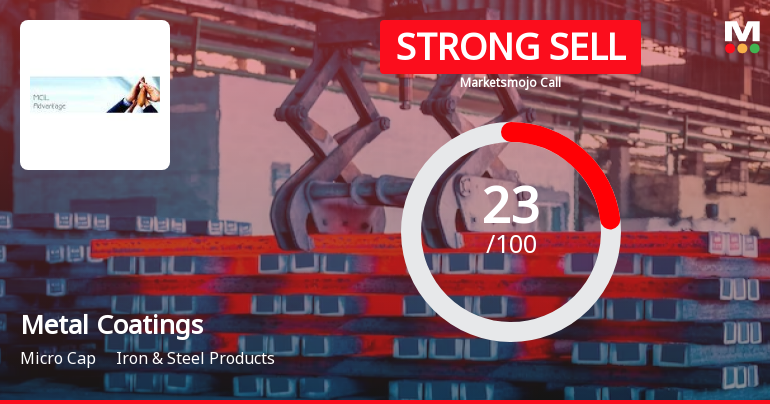
Strong Sell
Sell
Hold
Buy
Strong Buy

Dashboard

1

Weak Long Term Fundamental Strength with a -10.05% CAGR growth in Operating Profits over the last 5 years

  • The company has been able to generate a Return on Equity (avg) of 6.64% signifying low profitability per unit of shareholders funds
2

Flat results in Jun 26

stock-summaryMojo Parameters

Mojo Parameters

Loading Valuation Snapshot...

Stock DNA

stock-summary
Industry

Iron & Steel Products

stock-summary
Market cap

INR 39 Cr (Micro Cap)

stock-summary
P/E

15.00

stock-summary
Industry P/E

9

stock-summary
Dividend Yield

1.89%

stock-summary
Debt Equity

-0.14

stock-summary
Return on Equity

5.82%

stock-summary
Price to Book

0.88

Revenue and Profits:
Net Sales:
38 Cr
(Quarterly Results - Jun 2026)
Net Profit:
1 Cr
stock-summaryTotal Returns
Total Returns (Price + Dividend) stock-summary
Dividend Yield (1.89%)
TimePeriod
Price Return
Dividend Return
Total Return
3 Months
-12.33%
1.67%
-10.66%
6 Months
-9.87%
1.70%
-8.17%
1 Year
-28.45%
1.36%
-27.09%
2 Years
-37.14%
2.32%
-34.82%
3 Years
-48.14%
2.02%
-46.12%
4 Years
19.63%
3.20%
22.83%
5 Years
40.68%
5.43%
46.11%

Latest dividend: 0.9640740740740741 per share ex-dividend date: Aug-13-2026

Risk Adjusted Returns v/s stock-summary
Returns Beta
Icon
Beta has not been calculated since enough price history is not available
stock-summaryNews & Corporate Actions

Announcements stock-summary

Shareholder Meeting / Postal Ballot-Scrutinizers Report

21-Aug-2026 | Source : BSE

Pursuant to Regulation 44 of SEBI (LODR) Regulations 2015 the details regarding voting results of business transacted at the 32nd AGM of the Company along with a copy of Scrutinizers Report.

Shareholder Meeting / Postal Ballot-Outcome of AGM

20-Aug-2026 | Source : BSE

Proceedings of the 32nd Annual General Meeting of Metal Coatings (India) Limited held on Thursday 20th August 2026 through Video Conferencing/Other Audio Visual Means.

Announcement under Regulation 30 (LODR)-Meeting Updates

20-Aug-2026 | Source : BSE

Proceedings of the 32nd Annual General Meeting of Metal Coatings (India) Limited held on Thursday 20th August 2026 through Video Conferencing/Other Audio Visual Means.

Corporate Actions stock-summary

stock-summary
BOARD MEETING

No Upcoming Board Meetings

stock-summary
DIVIDEND

Metal Coatings (India) Ltd has declared 10% dividend, ex-date: 13 Aug 26

stock-summary
SPLITS

No Splits history available

stock-summary
BONUS

No Bonus history available

stock-summary
RIGHTS

No Rights history available

stock-summaryKey Factors

Quality key factors stock-summary

Factor
Value
Sales Growth (5y)
5.57%
EBIT Growth (5y)
-10.05%
EBIT to Interest (avg)
2.54
Debt to EBITDA (avg)
1.22
Net Debt to Equity (avg)
-0.14
Sales to Capital Employed (avg)
3.69
Tax Ratio
27.20%
Dividend Payout Ratio
30.53%
Pledged Shares
0
Institutional Holding
0
ROCE (avg)
9.96%
ROE (avg)
6.64%

Valuation key factors

Factor
Value
P/E Ratio
15
Industry P/E
9
Price to Book Value
0.85
EV to EBIT
11.87
EV to EBITDA
9.83
EV to Capital Employed
0.83
EV to Sales
0.21
PEG Ratio
0.96
Dividend Yield
1.96%
ROCE (Latest)
10.80%
ROE (Latest)
5.82%

Technicals key factors

Indicator
Weekly
Monthly
MACD
Mildly Bullish
Bearish
RSI
No Signal
No Signal
Bollinger Bands
Bearish
Bearish
Moving Averages
Bearish (Daily)
KST
Bearish
Bearish
Dow Theory
No Trend
No Trend
stock-summary Technical Indicator Scale: Bearish, Mildly Bearish, Sideways, Mildly Bullish, Bullish  Turned 
stock-summaryShareholding
Shareholding Snapshot : Jun 2026stock-summary
Shareholding Compare (%holding) stock-summary
Majority shareholders

Promoters

Pledged Promoter Holdings

None

Mutual Funds

Held by 0 Schemes

FIIs

Held by 0 FIIs

Promoter with highest holding

Khandelwal Galva Strips Private Limited (23.82%)

Highest Public shareholder

Bondwell Consultants Private Limited (2.59%)

Individual Investors Holdings

16.14%

stock-summaryFinancial
[
  {
    "link": "quarterly",
    "btn_text": "All Quarterly Results",
    "header": "Quarterly Results Snapshot (Standalone) - Jun'26 - QoQ",
    "rhs": [
      {
        "prefix": "Net Sales ",
        "suffix": "QoQ Growth in quarter ended Jun 2026 is 4.08% vs -3.85% in Mar 2026",
        "dir": 1
      },
      {
        "prefix": "Standalone Net Profit ",
        "suffix": "QoQ Growth in quarter ended Jun 2026 is 492.31% vs -86.46% in Mar 2026",
        "dir": 1
      }
    ],
    "table": {
      "header": [
        "Jun'26",
        "Mar'26",
        "Change(%)"
      ],
      "body": [
        {
          "field": "Net Sales",
          "val1": "38.25",
          "val2": "36.75",
          "chgp": "4.08%",
          "chgp_class": "positive"
        },
        {
          "field": "Operating Profit (PBDIT) excl Other Income",
          "val1": "0.75",
          "val2": "0.49",
          "chgp": "53.06%",
          "chgp_class": "positive"
        },
        {
          "field": "Interest",
          "val1": "0.01",
          "val2": "-0.02",
          "chgp": "150.00%",
          "chgp_class": "negative"
        },
        {
          "field": "Exceptional Items",
          "val1": "0.00",
          "val2": "0.00",
          "chgp": "",
          "chgp_class": "neutral"
        },
        {
          "field": "Standalone Net Profit",
          "val1": "0.77",
          "val2": "0.13",
          "chgp": "492.31%",
          "chgp_class": "positive"
        },
        {
          "field": "Operating Profit Margin (Excl OI)",
          "val1": "1.96%",
          "val2": "1.33%",
          "chgp": "0.63%",
          "chgp_class": "positive"
        }
      ]
    }
  },
  {
    "link": "half-yearly",
    "btn_text": "All Half Yearly Results",
    "header": "Half Yearly Results Snapshot (Standalone) - Sep'25",
    "rhs": [
      {
        "prefix": "Net Sales ",
        "suffix": " Growth in half year ended Sep 2025 is -8.00% vs -2.25% in Sep 2024",
        "dir": -1
      },
      {
        "prefix": "Standalone Net Profit ",
        "suffix": " Growth in half year ended Sep 2025 is -16.56% vs 49.52% in Sep 2024",
        "dir": -1
      }
    ],
    "table": {
      "header": [
        "Sep'25",
        "Sep'24",
        "Change(%)"
      ],
      "body": [
        {
          "field": "Net Sales",
          "val1": "74.01",
          "val2": "80.45",
          "chgp": "-8.00%",
          "chgp_class": "negative"
        },
        {
          "field": "Operating Profit (PBDIT) excl Other Income",
          "val1": "1.37",
          "val2": "1.98",
          "chgp": "-30.81%",
          "chgp_class": "negative"
        },
        {
          "field": "Interest",
          "val1": "0.02",
          "val2": "0.00",
          "chgp": "",
          "chgp_class": "neutral"
        },
        {
          "field": "Exceptional Items",
          "val1": "0.00",
          "val2": "0.00",
          "chgp": "",
          "chgp_class": "neutral"
        },
        {
          "field": "Standalone Net Profit",
          "val1": "1.31",
          "val2": "1.57",
          "chgp": "-16.56%",
          "chgp_class": "negative"
        },
        {
          "field": "Operating Profit Margin (Excl OI)",
          "val1": "1.85%",
          "val2": "2.46%",
          "chgp": "-0.61%",
          "chgp_class": "negative"
        }
      ]
    }
  },
  {
    "link": "nine-monthly",
    "btn_text": "All Nine Monthly Results",
    "header": "Nine Monthly Results Snapshot (Standalone) - Dec'25",
    "rhs": [
      {
        "prefix": "Net Sales ",
        "suffix": "YoY Growth in nine months ended Dec 2025 is -6.06% vs -3.99% in Dec 2024",
        "dir": -1
      },
      {
        "prefix": "Standalone Net Profit ",
        "suffix": "YoY Growth in nine months ended Dec 2025 is 118.27% vs -32.90% in Dec 2024",
        "dir": 1
      }
    ],
    "table": {
      "header": [
        "Dec'25",
        "Dec'24",
        "Change(%)"
      ],
      "body": [
        {
          "field": "Net Sales",
          "val1": "112.23",
          "val2": "119.47",
          "chgp": "-6.06%",
          "chgp_class": "negative"
        },
        {
          "field": "Operating Profit (PBDIT) excl Other Income",
          "val1": "2.45",
          "val2": "3.51",
          "chgp": "-30.20%",
          "chgp_class": "negative"
        },
        {
          "field": "Interest",
          "val1": "0.03",
          "val2": "2.34",
          "chgp": "-98.72%",
          "chgp_class": "positive"
        },
        {
          "field": "Exceptional Items",
          "val1": "0.00",
          "val2": "0.00",
          "chgp": "",
          "chgp_class": "neutral"
        },
        {
          "field": "Standalone Net Profit",
          "val1": "2.27",
          "val2": "1.04",
          "chgp": "118.27%",
          "chgp_class": "positive"
        },
        {
          "field": "Operating Profit Margin (Excl OI)",
          "val1": "2.18%",
          "val2": "2.94%",
          "chgp": "-0.76%",
          "chgp_class": "negative"
        }
      ]
    }
  },
  {
    "link": "annual",
    "btn_text": "All Annual Results",
    "header": "Annual Results Snapshot (Standalone) - Mar'26",
    "rhs": [
      {
        "prefix": "Net Sales ",
        "suffix": "YoY Growth in year ended Mar 2026 is -7.03% vs -4.85% in Mar 2025",
        "dir": -1
      },
      {
        "prefix": "Standalone Net Profit ",
        "suffix": "YoY Growth in year ended Mar 2026 is 1.27% vs -5.20% in Mar 2025",
        "dir": 1
      }
    ],
    "table": {
      "header": [
        "Mar'26",
        "Mar'25",
        "Change(%)"
      ],
      "body": [
        {
          "field": "Net Sales",
          "val1": "148.98",
          "val2": "160.25",
          "chgp": "-7.03%",
          "chgp_class": "negative"
        },
        {
          "field": "Operating Profit (PBDIT) excl Other Income",
          "val1": "2.94",
          "val2": "5.31",
          "chgp": "-44.63%",
          "chgp_class": "negative"
        },
        {
          "field": "Interest",
          "val1": "0.01",
          "val2": "2.37",
          "chgp": "-99.58%",
          "chgp_class": "positive"
        },
        {
          "field": "Exceptional Items",
          "val1": "0.00",
          "val2": "0.00",
          "chgp": "",
          "chgp_class": "neutral"
        },
        {
          "field": "Standalone Net Profit",
          "val1": "2.40",
          "val2": "2.37",
          "chgp": "1.27%",
          "chgp_class": "positive"
        },
        {
          "field": "Operating Profit Margin (Excl OI)",
          "val1": "1.97%",
          "val2": "3.31%",
          "chgp": "-1.34%",
          "chgp_class": "negative"
        }
      ]
    }
  }
]

Quarterly Results Snapshot (Standalone) - Jun'26 - QoQstock-summary

Jun'26
Mar'26
Change(%)
Net Sales
38.25
36.75
4.08%
Operating Profit (PBDIT) excl Other Income
0.75
0.49
53.06%
Interest
0.01
-0.02
150.00%
Exceptional Items
0.00
0.00
Standalone Net Profit
0.77
0.13
492.31%
Operating Profit Margin (Excl OI)
1.96%
1.33%
0.63%
Values in Rs Cr.
Direction Arrows
Net Sales

QoQ Growth in quarter ended Jun 2026 is 4.08% vs -3.85% in Mar 2026

Direction Arrows
Standalone Net Profit

QoQ Growth in quarter ended Jun 2026 is 492.31% vs -86.46% in Mar 2026

Half Yearly Results Snapshot (Standalone) - Sep'25stock-summary

Sep'25
Sep'24
Change(%)
Net Sales
74.01
80.45
-8.00%
Operating Profit (PBDIT) excl Other Income
1.37
1.98
-30.81%
Interest
0.02
0.00
Exceptional Items
0.00
0.00
Standalone Net Profit
1.31
1.57
-16.56%
Operating Profit Margin (Excl OI)
1.85%
2.46%
-0.61%
Values in Rs Cr.
Direction Arrows
Net Sales

Growth in half year ended Sep 2025 is -8.00% vs -2.25% in Sep 2024

Direction Arrows
Standalone Net Profit

Growth in half year ended Sep 2025 is -16.56% vs 49.52% in Sep 2024

Nine Monthly Results Snapshot (Standalone) - Dec'25stock-summary

Dec'25
Dec'24
Change(%)
Net Sales
112.23
119.47
-6.06%
Operating Profit (PBDIT) excl Other Income
2.45
3.51
-30.20%
Interest
0.03
2.34
-98.72%
Exceptional Items
0.00
0.00
Standalone Net Profit
2.27
1.04
118.27%
Operating Profit Margin (Excl OI)
2.18%
2.94%
-0.76%
Values in Rs Cr.
Direction Arrows
Net Sales

YoY Growth in nine months ended Dec 2025 is -6.06% vs -3.99% in Dec 2024

Direction Arrows
Standalone Net Profit

YoY Growth in nine months ended Dec 2025 is 118.27% vs -32.90% in Dec 2024

Annual Results Snapshot (Standalone) - Mar'26stock-summary

Mar'26
Mar'25
Change(%)
Net Sales
148.98
160.25
-7.03%
Operating Profit (PBDIT) excl Other Income
2.94
5.31
-44.63%
Interest
0.01
2.37
-99.58%
Exceptional Items
0.00
0.00
Standalone Net Profit
2.40
2.37
1.27%
Operating Profit Margin (Excl OI)
1.97%
3.31%
-1.34%
Values in Rs Cr.
Direction Arrows
Net Sales

YoY Growth in year ended Mar 2026 is -7.03% vs -4.85% in Mar 2025

Direction Arrows
Standalone Net Profit

YoY Growth in year ended Mar 2026 is 1.27% vs -5.20% in Mar 2025

stock-summaryCompany CV
About Metal Coatings (India) Ltd stock-summary
stock-summary
Metal Coatings (India) Ltd
Micro Cap
Iron & Steel Products
Metal Coatings (India) Limited (MCIL) was incorporated in December 1994, to take over the assets and liabilities of the Company, a partnership firm set up in 1988. The Company took over the operations of the firm in March 1995. The Company commenced its operations on 9 February, 1995. In 1995-96, it envisaged to enhance its capacity to 13200 tpa through an expansion-cum-backward integration scheme.
Company Coordinates stock-summary
Company Details
912 Hemkunt Chambers, 89 Nehru Place New Delhi New Delhi : 110019
stock-summary
Tel: 91-011-41808125
stock-summary
info@mcilindia.net
Registrar Details
Link Intime India Pvt Ltd., Narang Tower 44, Community Centre, Naraina Industrial Area , Phase - 1, New Delhi