
Compare Metal Coatings with Similar Stocks
Dashboard
Weak Long Term Fundamental Strength with a -2.36% CAGR growth in Operating Profits over the last 5 years
- The company has been able to generate a Return on Equity (avg) of 7.84% signifying low profitability per unit of shareholders funds
Flat results in Mar 26
Consistent Underperformance against the benchmark over the last 3 years
Stock DNA
Iron & Steel Products
INR 40 Cr (Micro Cap)
17.00
26
1.90%
-0.29
5.62%
0.90
Total Returns (Price + Dividend) 
Latest dividend: 1 per share ex-dividend date: Jul-23-2025
Risk Adjusted Returns v/s
Returns Beta

News
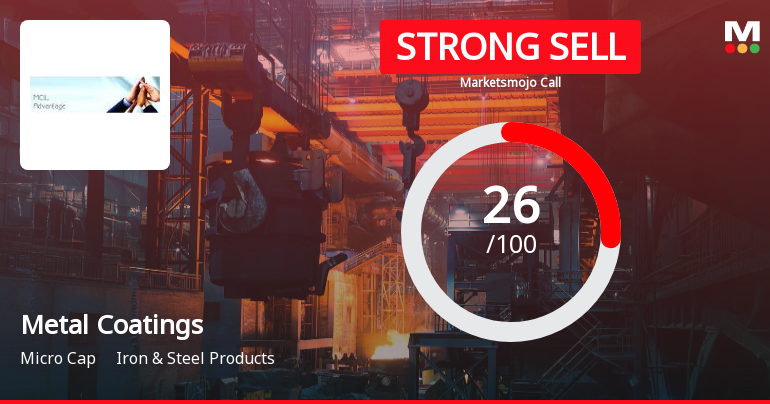
Metal Coatings (India) Ltd Downgraded to Strong Sell Amidst Flat Financials and Valuation Concerns
Metal Coatings (India) Ltd has been downgraded from a Sell to a Strong Sell rating following a comprehensive reassessment of its financial performance, valuation metrics, quality indicators, and technical outlook. The company’s flat financial trend in the latest quarter, combined with a shift to fair valuation and deteriorating quality scores, has prompted this decisive change in investment stance.
Read full news article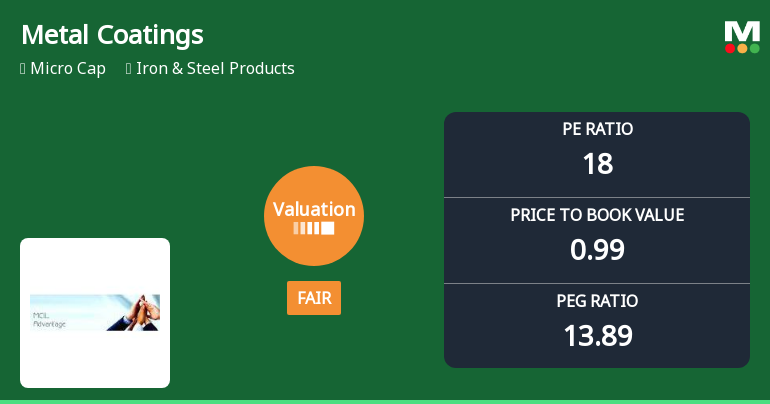
Metal Coatings (India) Ltd Valuation Shifts to Fair Amid Mixed Market Performance
Metal Coatings (India) Ltd, a micro-cap player in the Iron & Steel Products sector, has seen a notable shift in its valuation parameters, moving from a previously very attractive rating to a fair valuation. This change comes amid a backdrop of mixed returns and a deteriorating market sentiment, reflected in a recent downgrade to a Strong Sell rating by MarketsMOJO.
Read full news articleAre Metal Coatings (India) Ltd latest results good or bad?
Metal Coatings (India) Ltd's latest financial results for Q4 FY26 indicate significant operational challenges. The company reported a net profit of ₹0.13 crores, which reflects a substantial decline of 86.47% compared to the previous quarter. Revenue also decreased by 3.85% quarter-on-quarter, totaling ₹36.75 crores, marking the second consecutive quarter of revenue decline. The operating margin fell sharply to 1.33%, the lowest level in seven quarters, down from 2.83% in Q3 FY26. This margin compression suggests that the company is facing severe pricing pressures or rising costs that it has not been able to manage effectively. Additionally, the profit before tax plummeted by 75.21% from the previous quarter, highlighting a profitability crisis exacerbated by a significant increase in employee costs, which doubled to ₹3.95 crores. On a year-on-year basis, the company's performance is equally concerning, ...
Read full news article Announcements
Announcement under Regulation 30 (LODR)-Newspaper Publication
02-Jun-2026 | Source : BSEPlease find attached herewith the copies of Newspaper Advertisements published in the columns of English Daily Financial Express and Hindi Daily Jansatta on Tuesday 2nd June 2026 regarding the Re-opening of Special window for re-lodgement of the transfer request of physical shares.
Announcement under Regulation 30 (LODR)-Newspaper Publication
28-May-2026 | Source : BSEPlease find enclosed herewith the Newspaper Advertisement published on 28th May 2026 regarding Audited Financial Results for the quarter and the year ended 31st March 2026.
General-Updates
27-May-2026 | Source : BSEThe Board of directors of the Company have recommended final dividend for the financial year 2025-26.
Corporate Actions

No Upcoming Board Meetings

Metal Coatings (India) Ltd has declared 10% dividend, ex-date: 23 Jul 25

No Splits history available

No Bonus history available

No Rights history available
Quality key factors
Valuation key factors
Technicals key factors
 Technical Indicator Scale: Bearish, Mildly Bearish, Sideways, Mildly Bullish, Bullish Turned
 Shareholding Snapshot : Mar 2026
Shareholding Compare (%holding)
Promoters
None
Held by 0 Schemes
Held by 0 FIIs
Khandelwal Galva Strips Private Limited (23.82%)
Bondwell Financial Services (p) Ltd (2.59%)
14.86%
Quarterly Results Snapshot (Standalone) - Mar'26 - QoQ

QoQ Growth in quarter ended Mar 2026 is -3.85% vs -1.95% in Dec 2025
QoQ Growth in quarter ended Mar 2026 is -86.46% vs 37.14% in Dec 2025
Half Yearly Results Snapshot (Standalone) - Sep'25
Growth in half year ended Sep 2025 is -8.00% vs -2.25% in Sep 2024
Growth in half year ended Sep 2025 is -16.56% vs 49.52% in Sep 2024
Nine Monthly Results Snapshot (Standalone) - Dec'25
YoY Growth in nine months ended Dec 2025 is -6.06% vs -3.99% in Dec 2024

YoY Growth in nine months ended Dec 2025 is 118.27% vs -32.90% in Dec 2024
Annual Results Snapshot (Standalone) - Mar'26
YoY Growth in year ended Mar 2026 is -7.03% vs -4.85% in Mar 2025
YoY Growth in year ended Mar 2026 is 1.27% vs -5.20% in Mar 2025
About Metal Coatings (India) Ltd

Company Coordinates


