
Compare Midwest with Similar Stocks
Stock DNA
Diversified consumer products
INR 4,669 Cr (Small Cap)
45.00
32
0.00%
-0.04
10.90%
4.88
Total Returns (Price + Dividend) 
Midwest for the last several years.
Risk Adjusted Returns v/s
Returns Beta

News

Midwest Ltd Technical Momentum Shifts Amid Mixed Market Returns
Midwest Ltd, a small-cap player in the diversified consumer products sector, has experienced a subtle but notable shift in its technical momentum, coinciding with a recent downgrade from Hold to Sell by MarketsMOJO. Despite a modest intraday price gain of 0.50%, the company’s broader price action and technical indicators suggest a cautiously optimistic outlook tempered by underlying challenges.
Read full news article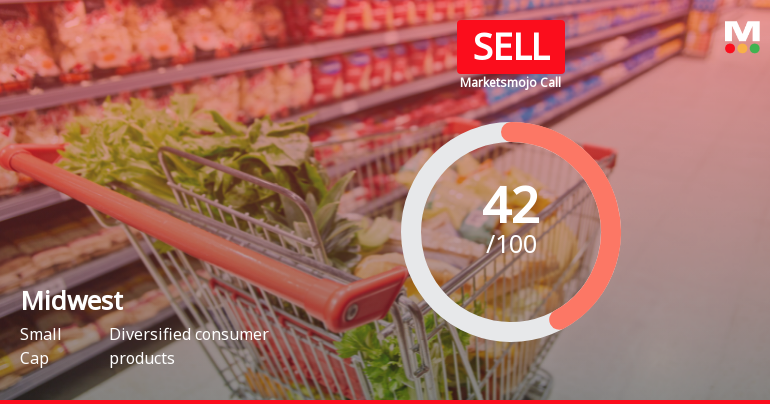
Midwest Ltd Downgraded to Sell Amidst Flat Financials and Technical Weakness
Midwest Ltd, a small-cap player in the diversified consumer products sector, has seen its investment rating downgraded from Hold to Sell by MarketsMOJO as of 23 June 2026. The downgrade reflects a combination of deteriorating technical indicators, stagnant financial performance, expensive valuation metrics, and subdued quality scores, signalling caution for investors amid challenging market conditions.
Read full news article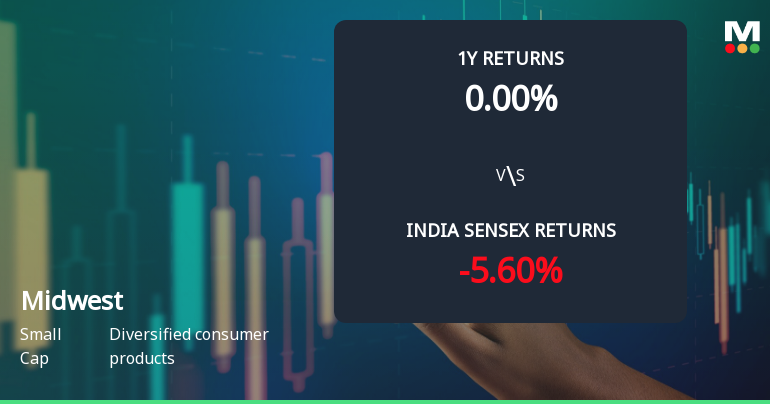
Midwest Ltd Technical Momentum Shifts Amid Mixed Market Returns
Midwest Ltd, a small-cap player in the diversified consumer products sector, has experienced a notable shift in its technical momentum, moving from a mildly bullish stance to a sideways trend. Despite a modest day decline of 0.60%, the stock’s recent technical indicators reveal a complex picture that investors should carefully analyse amid broader market dynamics.
Read full news article Announcements
Corporate Actions

No Upcoming Board Meetings

No Dividend history available

No Splits history available

No Bonus history available

No Rights history available
Quality key factors
Valuation key factors
Technicals key factors
 Technical Indicator Scale: Bearish, Mildly Bearish, Sideways, Mildly Bullish, Bullish Turned
 Shareholding Snapshot : Mar 2026
Shareholding Compare (%holding)
Promoters
None
Held by 4 Schemes (6.4%)
Held by 13 FIIs (4.38%)
Rama Raghava Reddy Kollareddy (64.1%)
Svadha India Emerging Opportunities Scheme 1 (7.35%)
3.29%
Quarterly Results Snapshot (Standalone) - Mar'26 - QoQ

QoQ Growth in quarter ended Mar 2026 is 14.31% vs -15.71% in Dec 2025

QoQ Growth in quarter ended Mar 2026 is -11.46% vs -0.62% in Dec 2025
Half Yearly Results Snapshot (Standalone) - Sep'25
Not Applicable: The company has declared_date for only one period
Not Applicable: The company has declared_date for only one period
Nine Monthly Results Snapshot (Standalone) - Dec'25
Not Applicable: The company has declared_date for only one period
Not Applicable: The company has declared_date for only one period
Annual Results Snapshot (Consolidated) - Mar'26
YoY Growth in year ended Mar 2026 is 3.10% vs 6.93% in Mar 2025
YoY Growth in year ended Mar 2026 is -14.35% vs 26.81% in Mar 2025
About Midwest Ltd

Company Coordinates


