
Compare Midwest with Similar Stocks
Stock DNA
Diversified consumer products
INR 4,686 Cr (Small Cap)
44.00
30
0.00%
-0.04
10.90%
4.69
Total Returns (Price + Dividend) 
Midwest for the last several years.
Risk Adjusted Returns v/s
Returns Beta

News

Midwest Ltd Technical Momentum Shifts Amid Mixed Market Returns
Midwest Ltd, a small-cap player in the diversified consumer products sector, has experienced a notable shift in its technical momentum, moving from a mildly bearish stance to a sideways trend. Despite a 3.44% gain in the latest session, the company’s overall performance remains subdued compared to broader market benchmarks, prompting a downgrade in its Mojo Grade from Hold to Sell as of 1 June 2026.
Read full news article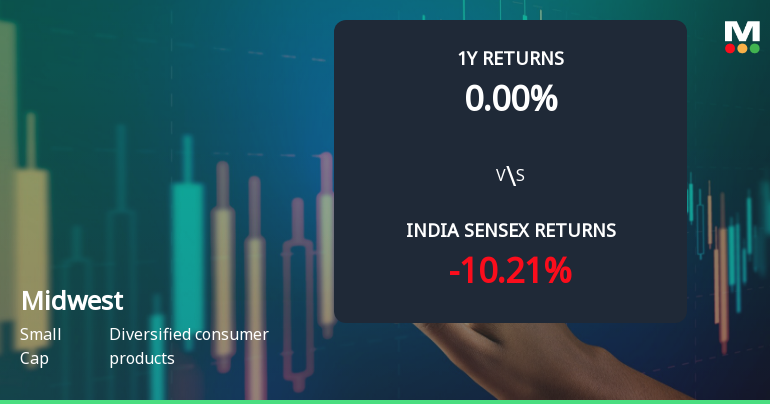
Midwest Ltd Faces Technical Downshift Amid Weak Price Momentum and Bearish Indicators
Midwest Ltd, a small-cap player in the diversified consumer products sector, has experienced a notable shift in its technical momentum, signalling a transition from a sideways trend to a mildly bearish phase. This change is underscored by deteriorating technical indicators including the MACD and Bollinger Bands, alongside a recent downgrade in its Mojo Grade from Hold to Sell, reflecting growing investor caution.
Read full news article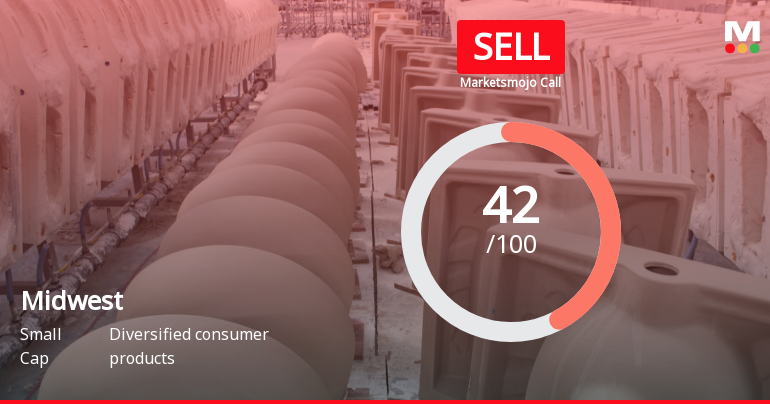
Midwest Ltd is Rated Sell by MarketsMOJO
Midwest Ltd is rated Sell by MarketsMOJO, with this rating last updated on 01 June 2026. However, the analysis and financial metrics discussed here reflect the stock's current position as of 10 June 2026, providing investors with the latest insights into the company’s performance and outlook.
Read full news article Announcements
Financial Results For The Quarter And Year Ended 31St March 2026.
02-Jun-2026 | Source : BSEFiling of the Financial Results for the Quarter and Year Ended 31st March 2026 along with the Declaration pursuant to Reg 33 (3) (d) of SEBI LODR.
Compliances-Reg.24(A)-Annual Secretarial Compliance
30-May-2026 | Source : BSEAnnual Secretarial compliance Report for the FY 25-26.
Announcement under Regulation 30 (LODR)-Earnings Call Transcript
30-May-2026 | Source : BSETranscript of the Earnings Call held on 27th May 2026.
Corporate Actions

No Upcoming Board Meetings

No Dividend history available

No Splits history available

No Bonus history available

No Rights history available
Quality key factors
Valuation key factors
Technicals key factors
 Technical Indicator Scale: Bearish, Mildly Bearish, Sideways, Mildly Bullish, Bullish Turned
 Shareholding Snapshot : Mar 2026
Shareholding Compare (%holding)
Promoters
None
Held by 4 Schemes (6.4%)
Held by 13 FIIs (4.38%)
Rama Raghava Reddy Kollareddy (64.1%)
Svadha India Emerging Opportunities Scheme 1 (7.35%)
3.29%
Quarterly Results Snapshot (Standalone) - Mar'26 - QoQ

QoQ Growth in quarter ended Mar 2026 is 14.31% vs -15.71% in Dec 2025

QoQ Growth in quarter ended Mar 2026 is -11.46% vs -0.62% in Dec 2025
Half Yearly Results Snapshot (Standalone) - Sep'25
Not Applicable: The company has declared_date for only one period
Not Applicable: The company has declared_date for only one period
Nine Monthly Results Snapshot (Standalone) - Dec'25
Not Applicable: The company has declared_date for only one period
Not Applicable: The company has declared_date for only one period
Annual Results Snapshot (Consolidated) - Mar'26
YoY Growth in year ended Mar 2026 is 3.10% vs 6.93% in Mar 2025
YoY Growth in year ended Mar 2026 is -14.35% vs 26.81% in Mar 2025
About Midwest Ltd

Company Coordinates


