
Compare Milestone Global with Similar Stocks
Dashboard
Weak Long Term Fundamental Strength with an average Return on Equity (ROE) of 6.80%
- Poor long term growth as Net Sales has grown by an annual rate of 1.17% and Operating profit at 4.06% over the last 5 years
- Company's ability to service its debt is weak with a poor EBIT to Interest (avg) ratio of 0.43
Flat results in Mar 26
Total Returns (Price + Dividend) 
Milestone Global for the last several years.
Risk Adjusted Returns v/s
Returns Beta

News
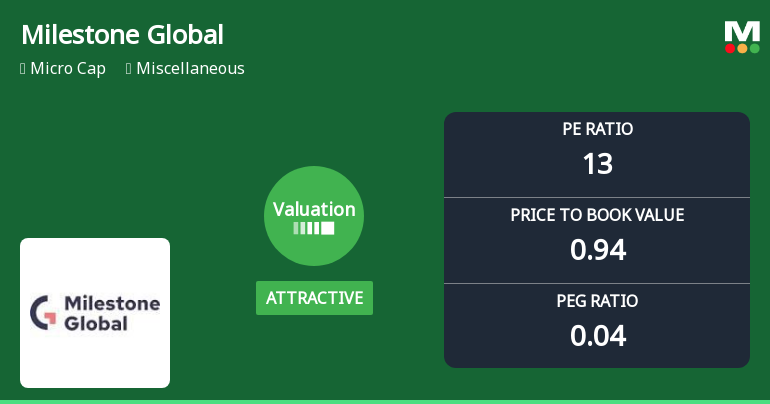
Milestone Global Ltd Valuation Shifts to Attractive Amid Mixed Market Returns
Milestone Global Ltd has seen a notable shift in its valuation parameters, moving from a fair to an attractive rating despite ongoing challenges in its share price and sector performance. This recalibration comes amid a backdrop of subdued returns relative to the broader market, raising important considerations for investors assessing the stock’s price attractiveness and future potential.
Read full news article
Milestone Global Ltd Valuation Shifts to Attractive Amid Mixed Market Returns
Milestone Global Ltd has undergone a significant re-rating in its valuation parameters, shifting from a previously expensive profile to one that now appears attractive relative to its historical averages and peer group. This change comes amid a backdrop of mixed returns and a micro-cap status, prompting investors to reassess the stock’s price appeal in the miscellaneous sector.
Read full news articleAre Milestone Global Ltd latest results good or bad?
Milestone Global Ltd's latest financial results for Q4 FY26 present a mixed picture. The company reported a net profit of ₹0.31 crores, reflecting a significant year-on-year increase of 416.67%. This profit surge is primarily attributed to a substantial improvement in operating margins, which expanded to 15.97% compared to 3.37% in the same quarter last year. However, this positive development is somewhat overshadowed by a revenue decline of 3.99% year-on-year, with total revenue for the quarter amounting to ₹3.13 crores, which is also a modest sequential increase of 3.64% from the previous quarter. The operational metrics indicate that while Milestone Global has managed to enhance its margins through cost control, the underlying revenue growth remains a concern, particularly given the company's exposure to developed markets where demand should ideally be stable. The full financial year FY26 saw a more pro...
Read full news article Announcements
Audited Financial Results For The Quarter And Year Ended 31St March 2026
23-May-2026 | Source : BSESubmission of audited financial results for the year ended 31st March 2026
Announcement under Regulation 30 (LODR)-Change in Directorate
23-May-2026 | Source : BSESubmission of Announcement under Regulation 30 with respect to re-appointment of Ms. Alka Agarwal as a Whole Time Director for a period of 5 years commencing from 6th January 2027 and fixing her remuneration subject to approval of shareholders in the ensuing annual general meeting.
Board Meeting Intimation for Inter Alia Considering And Approving The Audited Financial Results For The Year Ended 31St March 2026.
13-May-2026 | Source : BSEMilestone Global Ltdhas informed BSE that the meeting of the Board of Directors of the Company is scheduled on 23/05/2026 inter alia to consider and approve the audited financial results for year ended 31st March 2026 and also inter alia consider and approve the reappointment of Ms. Alka Agarwal as WTD and fixing remuneration and fixing remuneration of Mr. Fiyaz Ahmed as WTD for his remaining tenure.
Corporate Actions

No Upcoming Board Meetings

No Dividend history available

No Splits history available

No Bonus history available

No Rights history available
Quality key factors
Valuation key factors
Technicals key factors
 Technical Indicator Scale: Bearish, Mildly Bearish, Sideways, Mildly Bullish, Bullish Turned
 Shareholding Snapshot : Mar 2026
Shareholding Compare (%holding)
Promoters
None
Held by 2 Schemes (3.99%)
Held by 0 FIIs
Alka Agarwal (59.67%)
Abuzu Holdings Private Limited (4.55%)
14.68%
Quarterly Results Snapshot (Consolidated) - Mar'26 - QoQ

QoQ Growth in quarter ended Mar 2026 is 3.64% vs -17.26% in Dec 2025

QoQ Growth in quarter ended Mar 2026 is 181.82% vs 210.00% in Dec 2025
Half Yearly Results Snapshot (Consolidated) - Sep'25
Growth in half year ended Sep 2025 is 13.66% vs -5.23% in Sep 2024
Growth in half year ended Sep 2025 is 57.14% vs -58.82% in Sep 2024
Nine Monthly Results Snapshot (Consolidated) - Dec'25
YoY Growth in nine months ended Dec 2025 is 19.91% vs -21.46% in Dec 2024
YoY Growth in nine months ended Dec 2025 is 214.29% vs -85.71% in Dec 2024
Annual Results Snapshot (Consolidated) - Mar'26
YoY Growth in year ended Mar 2026 is 13.48% vs -20.63% in Mar 2025
YoY Growth in year ended Mar 2026 is 275.00% vs -72.60% in Mar 2025
About Milestone Global Ltd

Company Coordinates


