
Compare Minda Corp with Similar Stocks
Dashboard
Strong ability to service debt as the company has a low Debt to EBITDA ratio of 2.04 times
Healthy long term growth as Net Sales has grown by an annual rate of 21.17% and Operating profit at 31.84%
With a growth in Net Profit of 42.51%, the company declared Outstanding results in Mar 26
High Institutional Holdings at 27.63%
Consistent Returns over the last 3 years
Stock DNA
Auto Components & Equipments
INR 15,905 Cr (Small Cap)
44.00
37
0.23%
0.50
13.66%
5.98
Total Returns (Price + Dividend) 
Latest dividend: 0.5994982858098503 per share ex-dividend date: Feb-13-2026
Risk Adjusted Returns v/s
Returns Beta

News

Minda Corporation Ltd Technical Momentum Shifts Signal Bullish Outlook
Minda Corporation Ltd has exhibited a notable shift in its technical momentum, transitioning from a sideways trend to a mildly bullish stance. This change is underscored by a confluence of positive signals from key technical indicators such as MACD, Bollinger Bands, and Dow Theory, despite some mixed readings from RSI and moving averages. The stock’s recent price action and technical upgrades suggest growing investor confidence amid a strong performance relative to the broader market.
Read full news article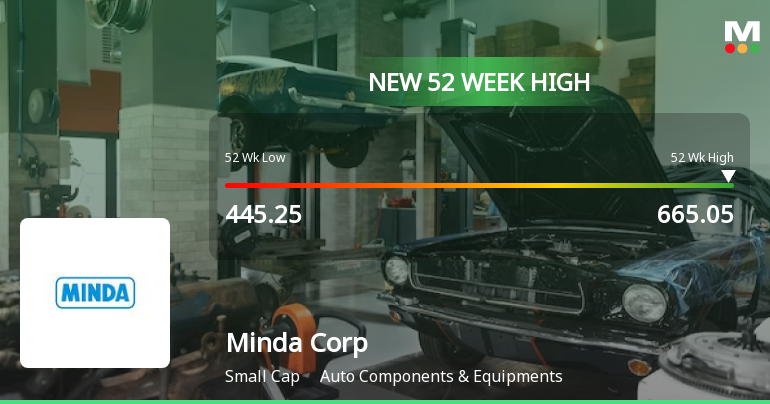
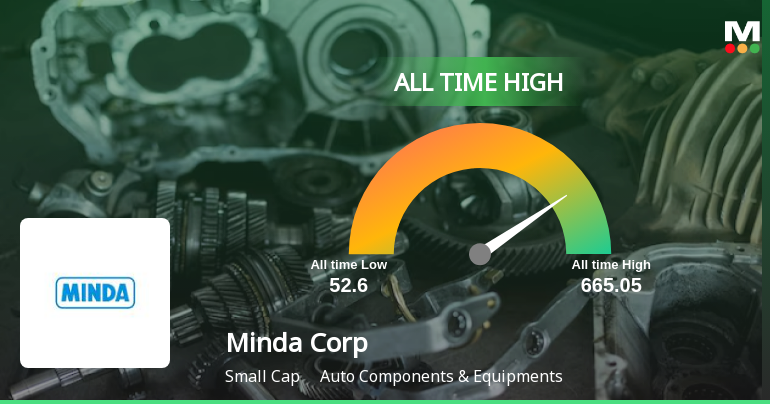
Minda Corporation Ltd Hits All-Time High of Rs 665.05 as Momentum Builds Across Timeframes
Extending its recent gains, Minda Corporation Ltd touched a fresh all-time high of Rs 665.05 on 15 Jun 2026, marking a significant milestone in its multi-year rally that has outpaced the broader market by a wide margin.
Read full news article Announcements
Intimation Of Record Date For Redemption Of Commercial Papers.
11-Jun-2026 | Source : BSEIntimation of record date for redemption of Commercial Papers of INR 200 crore.
Announcement under Regulation 30 (LODR)-Issue of Securities
09-Jun-2026 | Source : BSEIssue of Commercial Papers for INR 100 Crore
Disclosure Under Regulation 30 Regarding An Incidence Of Fire At Companys One Of The Plant At Noida.
31-May-2026 | Source : BSEDisclosure under Regulation 30 regarding an incidence of fire at Companys one of the Plant at Noida
Corporate Actions

No Upcoming Board Meetings

Minda Corporation Ltd has declared 30% dividend, ex-date: 13 Feb 26

Minda Corporation Ltd has announced 2:10 stock split, ex-date: 05 Jan 15

Minda Corporation Ltd has announced 1:1 bonus issue, ex-date: 05 Jan 15

No Rights history available
Quality key factors
Valuation key factors
Technicals key factors
 Technical Indicator Scale: Bearish, Mildly Bearish, Sideways, Mildly Bullish, Bullish Turned
 Shareholding Snapshot : Mar 2026
Shareholding Compare (%holding)
Promoters
None
Held by 19 Schemes (15.15%)
Held by 105 FIIs (8.8%)
Ashok Minda (34.19%)
None
4.18%
Quarterly Results Snapshot (Consolidated) - Mar'26 - QoQ

QoQ Growth in quarter ended Mar 2026 is 9.20% vs 1.62% in Dec 2025
QoQ Growth in quarter ended Mar 2026 is 45.40% vs 1.25% in Dec 2025
Half Yearly Results Snapshot (Consolidated) - Sep'25
Growth in half year ended Sep 2025 is 17.68% vs 9.34% in Sep 2024

Growth in half year ended Sep 2025 is 8.24% vs 33.24% in Sep 2024
Nine Monthly Results Snapshot (Consolidated) - Dec'25
YoY Growth in nine months ended Dec 2025 is 19.99% vs 8.70% in Dec 2024
YoY Growth in nine months ended Dec 2025 is 15.89% vs 29.95% in Dec 2024
Annual Results Snapshot (Consolidated) - Mar'26
YoY Growth in year ended Mar 2026 is 22.33% vs 8.71% in Mar 2025
YoY Growth in year ended Mar 2026 is 41.07% vs 12.39% in Mar 2025
About Minda Corporation Ltd

Company Coordinates


