
Compare Mini Diamonds(I) with Similar Stocks
Dashboard
With a Operating Losses, the company has a Weak Long Term Fundamental Strength
- Low ability to service debt as the company has a high Debt to EBITDA ratio of 1.21 times
- PAT(Q) At Rs -5.74 cr has Fallen at -612.5% (vs previous 4Q average)
- ROCE(HY) Lowest at 3.40%
- PBDIT(Q) Lowest at Rs -8.21 cr.
With ROE of 3.5, it has a Expensive valuation with a 2.6 Price to Book Value
Underperformed the market in the last 1 year
Stock DNA
Gems, Jewellery And Watches
INR 167 Cr (Micro Cap)
110.00
45
0.00%
0.02
3.53%
2.56
Total Returns (Price + Dividend) 
Mini Diamonds(I) for the last several years.
Risk Adjusted Returns v/s
Returns Beta

News
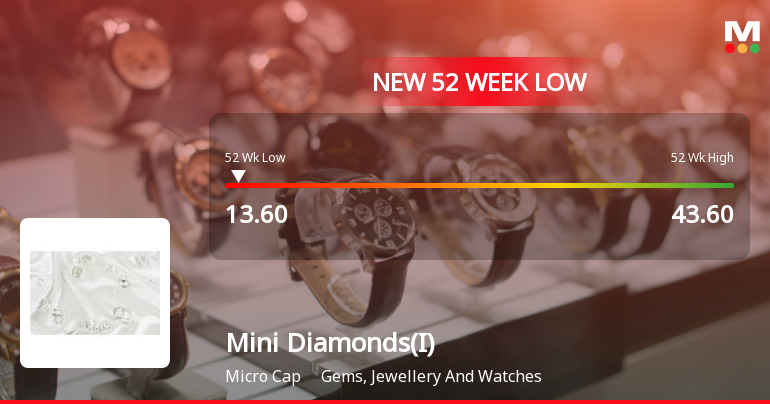
Mini Diamonds (India) Ltd Falls to 52-Week Low of Rs 13.6 as Sell-Off Deepens
A sharp decline over the past two sessions has dragged Mini Diamonds (India) Ltd to a fresh 52-week low of Rs 13.6 on 4 June 2026, marking a 66.1% drop over the last year and a stark underperformance relative to the broader market.
Read full news article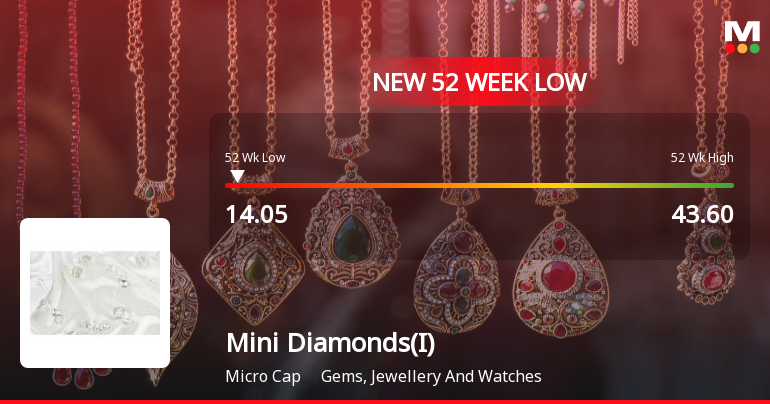
Mini Diamonds (India) Ltd Falls to 52-Week Low of Rs 14.05 as Sell-Off Deepens
A steep decline of nearly 66% over the past year has dragged Mini Diamonds (India) Ltd to a fresh 52-week low of Rs 14.05 on 2 Jun 2026, underscoring persistent pressure on this micro-cap within the Gems, Jewellery And Watches sector.
Read full news article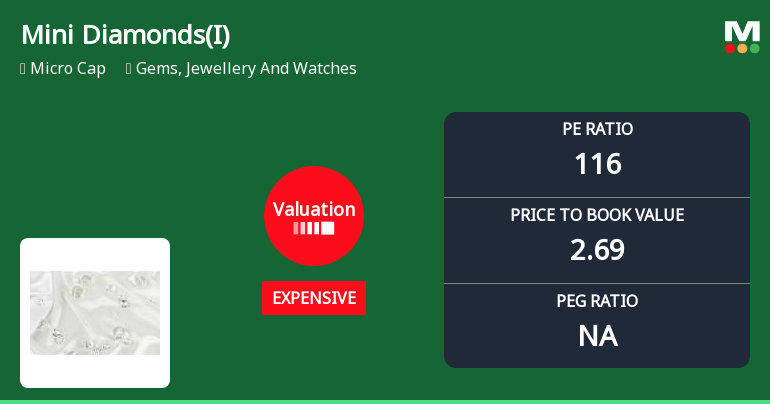
Mini Diamonds (India) Ltd Valuation Shifts Signal Price Attractiveness Decline
Mini Diamonds (India) Ltd has seen a marked shift in its valuation parameters, moving from fair to expensive territory, raising questions about its price attractiveness amid a challenging market backdrop and underwhelming financial metrics.
Read full news article Announcements
Record Date For Issuance Of Bonus Equity Shares Pursuant To Regulation 42 Of SEBI (Listing Obligations And Disclosure Requirements) Regulations 2015
09-Jun-2026 | Source : BSEThe Company has fixed Tuesday June 16 2026 as the Record Date for the purpose of determining the members eligible for issuance of bonus equity shares
Shareholder Meeting / Postal Ballot-Outcome of Postal_Ballot
02-Jun-2026 | Source : BSEPursuant to Regulation 44 of SEBI (Listing Obligation and Disclosure Requirements) Regulations 2015 please find enclosed herewith details regarding voting results along with Scrutinizers Report.
Expansion Of Namra JewelS Retail Presence Through FOFO Franchise Model
02-Jun-2026 | Source : BSEMini Diamonds (India) Limited through its wholly owned subsidiary Namra Jewels Private Limited is pleased to announce its proposed franchise expansion plan unde FOFO model.
Corporate Actions

No Upcoming Board Meetings

No Dividend history available

Mini Diamonds (India) Ltd has announced 2:10 stock split, ex-date: 02 Dec 25

Mini Diamonds (India) Ltd has announced 1:1 bonus issue, ex-date: 16 Jun 26

No Rights history available
Quality key factors
Valuation key factors
Technicals key factors
 Technical Indicator Scale: Bearish, Mildly Bearish, Sideways, Mildly Bullish, Bullish Turned
 Shareholding Snapshot : Mar 2026
Shareholding Compare (%holding)
Non Institution
None
Held by 0 Schemes
Held by 0 FIIs
Late Meena Upendra Shah (1.11%)
Shashank Pravinchandra Doshi (8.91%)
57.4%
Quarterly Results Snapshot (Standalone) - Mar'26 - QoQ

QoQ Growth in quarter ended Mar 2026 is -9.20% vs 11.51% in Dec 2025
QoQ Growth in quarter ended Mar 2026 is -257.98% vs 17.27% in Dec 2025
Half Yearly Results Snapshot (Standalone) - Sep'25
Growth in half year ended Sep 2025 is 29.40% vs 117.99% in Sep 2024
Growth in half year ended Sep 2025 is 18.25% vs 1,026.19% in Sep 2024
Nine Monthly Results Snapshot (Standalone) - Dec'25
YoY Growth in nine months ended Dec 2025 is 34.90% vs 91.93% in Dec 2024
YoY Growth in nine months ended Dec 2025 is 28.01% vs 667.50% in Dec 2024
Annual Results Snapshot (Standalone) - Mar'26
YoY Growth in year ended Mar 2026 is 40.01% vs 65.15% in Mar 2025
YoY Growth in year ended Mar 2026 is -53.49% vs 60.00% in Mar 2025
About Mini Diamonds (India) Ltd

Company Coordinates


