
Compare Minolta Finance with Similar Stocks
Stock DNA
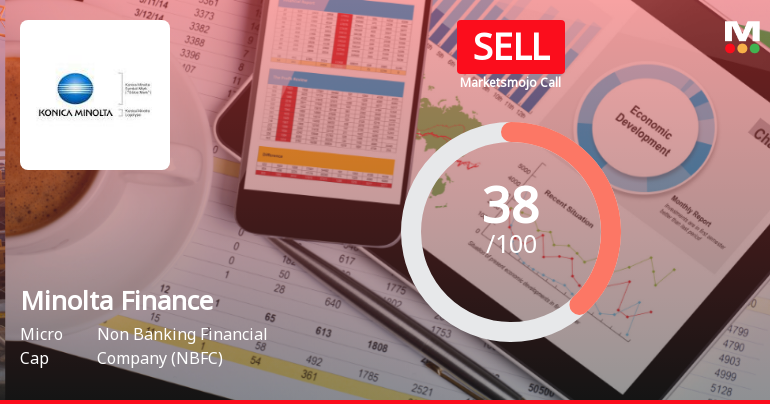
Non Banking Financial Company (NBFC)
INR 16 Cr (Micro Cap)
NA (Loss Making)
9
0.00%
19.11
-34.69%
1.76
Total Returns (Price + Dividend) 
Minolta Finance for the last several years.
Risk Adjusted Returns v/s
Returns Beta

News
Minolta Finance Ltd Downgraded to Sell Amid Flat Financials and Expensive Valuation
Minolta Finance Ltd, a micro-cap player in the Non Banking Financial Company (NBFC) sector, has seen its investment rating downgraded to a Sell with a Mojo Score of 38.0 as of 1 June 2026. This change reflects a combination of flat financial trends, expensive valuation metrics, and a cautiously optimistic technical outlook, despite the stock’s recent market-beating returns.
Read full news article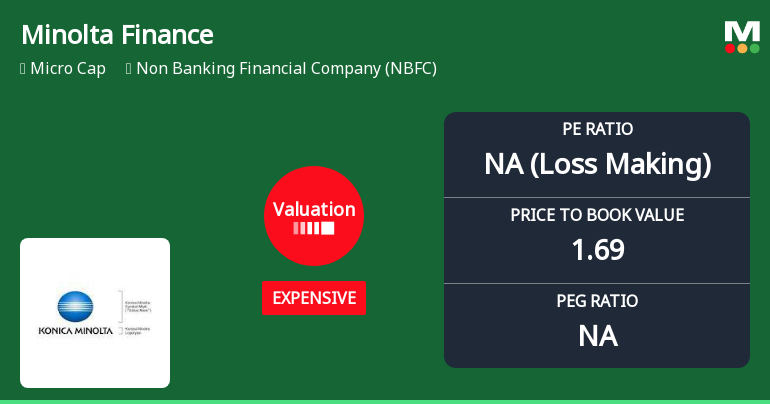
Minolta Finance Ltd Valuation Shifts Signal Price Attractiveness Concerns
Minolta Finance Ltd, a micro-cap player in the Non Banking Financial Company (NBFC) sector, has undergone a notable shift in its valuation parameters, moving from a risky to an expensive valuation grade. This change, coupled with its recent market performance and financial metrics, raises important questions about its price attractiveness relative to peers and historical benchmarks.
Read full news articleAre Minolta Finance Ltd latest results good or bad?
Minolta Finance Ltd's latest financial results for Q3 FY26 present a complex picture of recovery amidst ongoing challenges. The company reported a net profit of ₹2.31 crores, marking a significant turnaround from the previous quarter's net loss of ₹5.75 crores. This shift indicates a notable operational recovery, although it follows a period of considerable volatility in earnings. Revenue for the quarter reached ₹4.56 crores, reflecting an extraordinary year-on-year growth of 1972.73% compared to ₹0.22 crores in Q3 FY25. However, this figure must be contextualized within the preceding quarter's negative revenue of ₹0.04 crores, which complicates the interpretation of genuine business momentum. The quarter-on-quarter revenue change of 11,500% further underscores the erratic nature of the company's financial performance. The operating profit margin, excluding other income, stood at 77.85%, which, while appe...
Read full news article Announcements
Disclosure Under Regulation 31 (4) Of SEBI (Substantial Acquisition Of Shares And Takeovers) Regulations 2011.
08-Jun-2026 | Source : BSEWith reference to the above mentioned subject please find enclosed herewith the declaration regarding no encumbrances of share pursuant to regulation 31 (4) of SEBI Received from promoters and person in concert of Minolta Finance limited for the financial year March 312026.
Compliances-Reg.24(A)-Annual Secretarial Compliance
28-May-2026 | Source : BSEThis is to certify that in order to comply with Regulation 24A of SEBI the paid up share capital does not exceed Rs 10 Crore and net worth does not exceed Rs 25 Crore as on the last day of previous financial year March 31st 2026.Our Company is not required to submit the Annual Secretarial Compliance Report.
Announcement under Regulation 30 (LODR)-Newspaper Publication
28-May-2026 | Source : BSEIn Compliance with regulation 30 of SEBI LODR The Audited financial result of the Company for the quarter and year ended March 312026 approved by the board of director in its meeting held on Tuesday March 262026 were published in Ek din on March 28 2026.
Corporate Actions

No Upcoming Board Meetings

No Dividend history available

Minolta Finance Ltd has announced 1:10 stock split, ex-date: 06 Feb 25

No Bonus history available

No Rights history available
Quality key factors
Valuation key factors
Technicals key factors
 Technical Indicator Scale: Bearish, Mildly Bearish, Sideways, Mildly Bullish, Bullish Turned
 Shareholding Snapshot : Mar 2026
Shareholding Compare (%holding)
Non Institution
None
Held by 0 Schemes
Held by 0 FIIs
Marshall Commodities Private Limited (1.27%)
Bobros Consultancy Services Private Limi (10.95%)
45.81%
Quarterly Results Snapshot (Standalone) - Mar'26 - QoQ

QoQ Growth in quarter ended Mar 2026 is 17.98% vs 11,500.00% in Dec 2025
QoQ Growth in quarter ended Mar 2026 is -102.87% vs 142.43% in Dec 2025
Half Yearly Results Snapshot (Standalone) - Sep'25

Growth in half year ended Sep 2025 is 339.13% vs 27.78% in Sep 2024
Growth in half year ended Sep 2025 is -18,766.67% vs 0.00% in Sep 2024
Nine Monthly Results Snapshot (Standalone) - Dec'25
YoY Growth in nine months ended Dec 2025 is 867.65% vs 28.30% in Dec 2024
YoY Growth in nine months ended Dec 2025 is -5,366.67% vs 50.00% in Dec 2024
Annual Results Snapshot (Standalone) - Mar'26
YoY Growth in year ended Mar 2026 is 1,072.55% vs 34.21% in Mar 2025
YoY Growth in year ended Mar 2026 is -14,400.00% vs -80.00% in Mar 2025
About Minolta Finance Ltd

Company Coordinates


