
Compare Mitcon Consult. with Similar Stocks
Dashboard
Weak Long Term Fundamental Strength with an average Return on Capital Employed (ROCE) of 7.44%
- Poor long term growth as Net Sales has grown by an annual rate of 4.22% and Operating profit at 18.27% over the last 5 years
- Low ability to service debt as the company has a high Debt to EBITDA ratio of 3.18 times
With a growth in Net Profit of 185.28%, the company declared Very Positive results in Mar 26
With ROCE of 8.8, it has a Very Attractive valuation with a 0.9 Enterprise value to Capital Employed
High Institutional Holdings at 24.67%
Total Returns (Price + Dividend) 
Latest dividend: 0.20000000000000004 per share ex-dividend date: Aug-05-2021
Risk Adjusted Returns v/s
Returns Beta

News
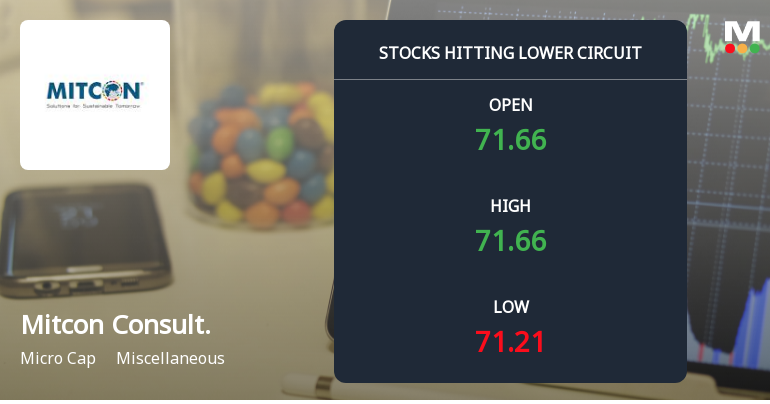
Mitcon Consultancy & Engineering Services Ltd Locks at Lower Circuit With 4.99% Loss — Sellers Queue, No Buyers in Sight
At Rs 71.21, sellers were still queuing — but there were no buyers willing to take the other side. Mitcon Consultancy & Engineering Services Ltd locked at its lower circuit of 4.99% on 20 Jul 2026, with unfilled sell orders and a frozen price.
Read full news article
Mitcon Consultancy & Engineering Services Ltd is Rated Sell
Mitcon Consultancy & Engineering Services Ltd is rated Sell by MarketsMOJO, with this rating last updated on 15 July 2026. While the rating change occurred on that date, the analysis and financial metrics discussed here reflect the stock’s current position as of 19 July 2026, providing investors with the most up-to-date perspective on the company’s fundamentals, valuation, financial trends, and technical outlook.
Read full news article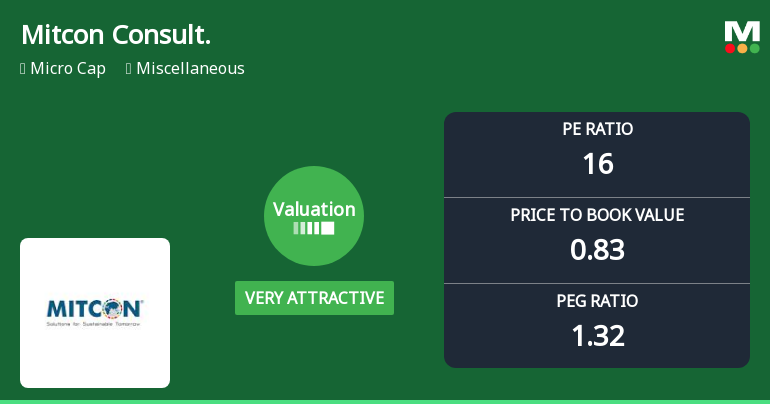
Mitcon Consultancy & Engineering Services Ltd Valuation Shifts to Very Attractive Amid Mixed Market Returns
Mitcon Consultancy & Engineering Services Ltd has seen a notable shift in its valuation parameters, moving from an attractive to a very attractive rating, driven primarily by improved price-to-earnings and price-to-book value ratios. Despite a recent dip in share price, the company’s valuation metrics now present a compelling case for investors seeking value in the miscellaneous sector, especially when compared with peers and historical benchmarks.
Read full news article Announcements
MITCON Consultancy & Engineering Services Limited - Clarification - Financial Results
27-Nov-2019 | Source : NSEMITCON Consultancy & Engineering Services Limitedancy & Engineering Services Limited for the quarter ended 30-Sep-2019 with respect to Regulation 33 of the SEBI (Listing Obligations and Disclosure Requirements) Regulations, 2015.
MITCON Consultancy & Engineering Services Limited - Outcome of Board Meeting
13-Nov-2019 | Source : NSEMITCON Consultancy & Engineering Services Limited has informed the Exchange regarding Board meeting held on November 13, 2019.
MITCON Consultancy & Engineering Services Limited - Clarification
25-Oct-2019 | Source : NSEMITCON Consultancy & Engineering Services Limitedvices Limited with respect to announcement dated 09-Oct-2019, regarding Board meeting held on October 09, 2019. On basis of above the Company is required to clarify following: 1.áBrief profile, date of appointment & term of appointment of Mr. Ashok K Agarwalá á2.áDisclosureá ofá relationshipsá betweená directors iná caseá ofá appointmentá ofá Mr. Ashok K Agarwalá The response of the Company is awaited.
Corporate Actions

No Upcoming Board Meetings

Mitcon Consultancy & Engineering Services Ltd has declared 2% dividend, ex-date: 05 Aug 21

No Splits history available

No Bonus history available

Mitcon Consultancy & Engineering Services Ltd has announced 6:19 rights issue, ex-date: 20 Jun 24
Quality key factors
Valuation key factors
Technicals key factors
 Technical Indicator Scale: Bearish, Mildly Bearish, Sideways, Mildly Bullish, Bullish Turned
 Shareholding Snapshot : Mar 2026
Shareholding Compare (%holding)
Non Institution
None
Held by 0 Schemes
Held by 3 FIIs (18.24%)
None
Beesley Consultancy Private Limited (15.87%)
25.14%
Quarterly Results Snapshot (Consolidated) - Mar'26 - YoY

YoY Growth in quarter ended Mar 2026 is 18.62% vs -4.58% in Mar 2025
YoY Growth in quarter ended Mar 2026 is 179.29% vs 3.05% in Mar 2025
Half Yearly Results Snapshot (Consolidated) - Sep'25
Growth in half year ended Sep 2025 is 3.08% vs -19.95% in Sep 2024

Growth in half year ended Sep 2025 is -44.32% vs 35.71% in Sep 2024
Nine Monthly Results Snapshot (Consolidated) - Dec'25
YoY Growth in nine months ended Dec 2025 is 7.84% vs -16.62% in Dec 2024
YoY Growth in nine months ended Dec 2025 is -13.18% vs 4.59% in Dec 2024
Annual Results Snapshot (Consolidated) - Mar'26
YoY Growth in year ended Mar 2026 is 11.50% vs -12.91% in Mar 2025
YoY Growth in year ended Mar 2026 is 45.50% vs 4.32% in Mar 2025
About Mitcon Consultancy & Engineering Services Ltd

Company Coordinates


