
Compare Modi Naturals with Similar Stocks
Stock DNA
Other Agricultural Products
INR 566 Cr (Micro Cap)
12.00
27
0.00%
0.89
27.07%
3.26
Total Returns (Price + Dividend) 
Modi Naturals for the last several years.
Risk Adjusted Returns v/s
Returns Beta

News

Modi Naturals Ltd Upgraded to Buy on Strong Fundamentals and Improved Technicals
Modi Naturals Ltd, a micro-cap player in the Other Agricultural Products sector, has seen its investment rating upgraded from Hold to Buy as of 10 June 2026. This upgrade follows a comprehensive reassessment across four key parameters: quality, valuation, financial trend, and technicals. The company’s improved technical indicators, very attractive valuation metrics, and robust financial performance underpin this positive revision despite recent share price volatility.
Read full news article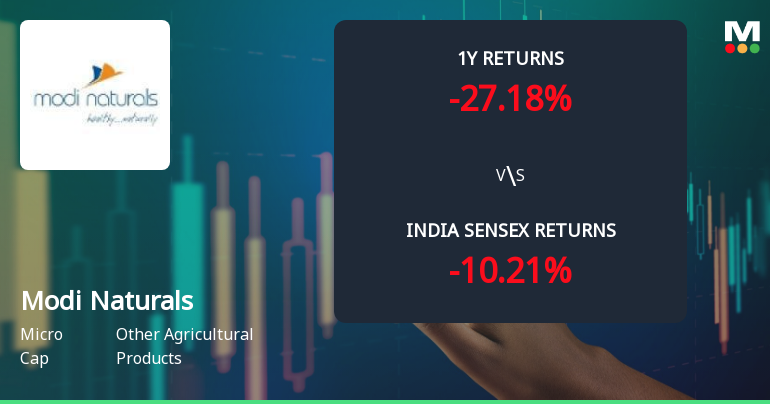
Modi Naturals Ltd Technical Momentum Shifts Signal Mildly Bullish Outlook
Modi Naturals Ltd, a micro-cap player in the Other Agricultural Products sector, has witnessed a notable shift in its technical momentum from mildly bearish to mildly bullish, reflecting evolving market sentiment despite a recent 4.04% decline in its share price. This article analyses the key technical indicators shaping the stock’s outlook and places its performance in the context of broader market trends.
Read full news article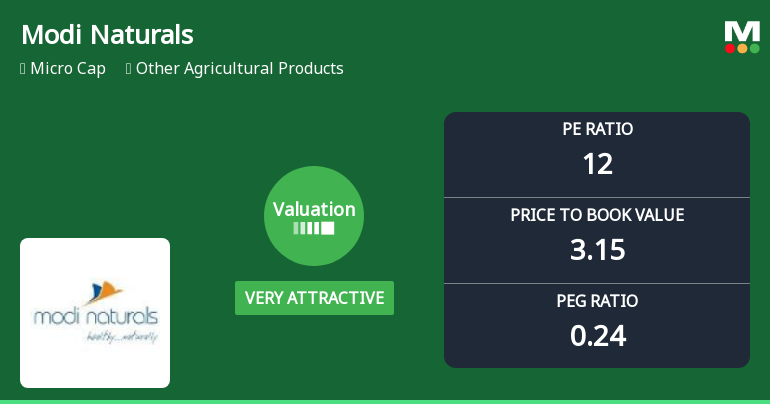
Modi Naturals Ltd Valuation Turns Very Attractive Amid Market Volatility
Modi Naturals Ltd, a micro-cap player in the Other Agricultural Products sector, has seen a significant shift in its valuation parameters, moving from an attractive to a very attractive rating. Despite a recent 4.04% dip in its share price to ₹407.05, the company’s price-to-earnings (P/E) and price-to-book value (P/BV) ratios now present compelling entry points compared to historical levels and peer benchmarks.
Read full news article Announcements
Report On Transfer Requests Of Physical Shares Re-Lodged Under The Special Window
03-Jun-2026 | Source : BSEReport on Transfer Requests of Physical Shares re-lodged under the Special Window
Compliances-Reg.24(A)-Annual Secretarial Compliance
23-May-2026 | Source : BSEAnnual Secretarial Compliance Report
Announcement under Regulation 30 (LODR)-Earnings Call Transcript
19-May-2026 | Source : BSEEarning Call Transcript
Corporate Actions

No Upcoming Board Meetings

No Dividend history available

No Splits history available

Modi Naturals Ltd has announced 1:1 bonus issue, ex-date: 14 Oct 09

No Rights history available
Quality key factors
Valuation key factors
Technicals key factors
 Technical Indicator Scale: Bearish, Mildly Bearish, Sideways, Mildly Bullish, Bullish Turned
 Shareholding Snapshot : Mar 2026
Shareholding Compare (%holding)
Promoters
None
Held by 0 Schemes
Held by 0 FIIs
Nita Modi (29.65%)
Nikhil Kishorchandra Vora (5.8%)
27.63%
Quarterly Results Snapshot (Consolidated) - Mar'26 - QoQ

QoQ Growth in quarter ended Mar 2026 is 39.63% vs 18.44% in Dec 2025
QoQ Growth in quarter ended Mar 2026 is 95.92% vs -0.30% in Dec 2025
Half Yearly Results Snapshot (Consolidated) - Sep'25

Growth in half year ended Sep 2025 is 2.65% vs 67.58% in Sep 2024
Growth in half year ended Sep 2025 is 36.77% vs 870.32% in Sep 2024
Nine Monthly Results Snapshot (Consolidated) - Dec'25
YoY Growth in nine months ended Dec 2025 is 0.61% vs 63.39% in Dec 2024
YoY Growth in nine months ended Dec 2025 is 33.90% vs 1,365.38% in Dec 2024
Annual Results Snapshot (Consolidated) - Mar'26
YoY Growth in year ended Mar 2026 is 8.49% vs 65.80% in Mar 2025
YoY Growth in year ended Mar 2026 is 62.04% vs 2,348.55% in Mar 2025
About Modi Naturals Ltd

Company Coordinates


