
Compare Modi Rubber with Similar Stocks
Dashboard
With a Operating Losses, the company has a Weak Long Term Fundamental Strength
- Company's ability to service its debt is weak with a poor EBIT to Interest (avg) ratio of -16.52
- The company has reported losses. Due to this company has reported negative ROCE
Negative results in Mar 26
Risky - Negative EBITDA
Stock DNA
Tyres & Rubber Products
INR 320 Cr (Micro Cap)
496.00
19
0.00%
-0.07
0.09%
0.46
Total Returns (Price + Dividend) 
Modi Rubber for the last several years.
Risk Adjusted Returns v/s
Returns Beta

News

Modi Rubber Ltd is Rated Strong Sell
Modi Rubber Ltd is rated Strong Sell by MarketsMOJO, with this rating last updated on 02 June 2026. However, the analysis and financial metrics discussed here reflect the stock’s current position as of 11 June 2026, providing investors with the most up-to-date view of the company’s fundamentals, returns, and market standing.
Read full news article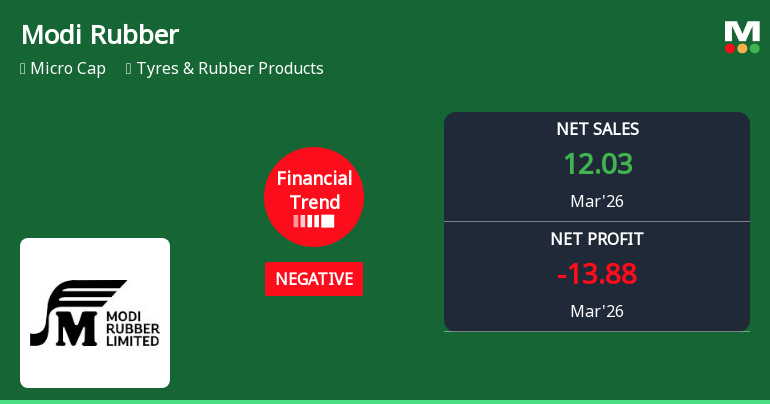
Modi Rubber Ltd Reports Sharp Quarterly Decline Amid Negative Financial Trend
Modi Rubber Ltd, a micro-cap player in the Tyres & Rubber Products sector, has reported a marked deterioration in its financial performance for the quarter ended March 2026, signalling a shift from a previously flat trend to a distinctly negative trajectory. Despite some operational highlights, the company’s profitability metrics have plunged, raising concerns among investors and analysts alike.
Read full news article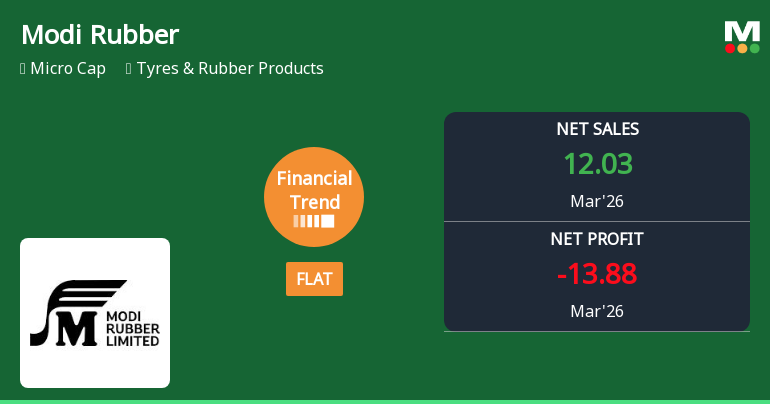
Modi Rubber Ltd Reports Mixed Quarterly Results Amid Margin Pressures
Modi Rubber Ltd, a micro-cap player in the Tyres & Rubber Products sector, has posted a mixed set of quarterly results for March 2026, reflecting a shift from flat to negative financial trends. Despite record net sales and improved cash reserves, the company continues to grapple with significant losses and margin contraction, prompting a downgrade in its Mojo Grade to Sell from Strong Sell.
Read full news article Announcements
Results As On 31St March 2026
29-May-2026 | Source : BSEResults(standalone and consolidated) Results as on March 31st 2026
Announcement under Regulation 30 (LODR)-Change in Directorate
29-May-2026 | Source : BSEAppointment of Mr Ajay Kumar Jain (00097213) as non-executive Independent director of the company
Board Meeting Outcome for Outcome Of Board Meeting
29-May-2026 | Source : BSEoutcome of Board Meeting
Corporate Actions

No Upcoming Board Meetings

No Dividend history available

No Splits history available

No Bonus history available

No Rights history available
Quality key factors
Valuation key factors
Technicals key factors
 Technical Indicator Scale: Bearish, Mildly Bearish, Sideways, Mildly Bullish, Bullish Turned
 Shareholding Snapshot : Mar 2026
Shareholding Compare (%holding)
Promoters
None
Held by 2 Schemes (0.0%)
Held by 2 FIIs (0.01%)
Mod Fashions And Securities Private Limited (47.96%)
Kinborough Limited (22.92%)
9.42%
Quarterly Results Snapshot (Consolidated) - Mar'26 - QoQ

QoQ Growth in quarter ended Mar 2026 is 64.34% vs -6.27% in Dec 2025

QoQ Growth in quarter ended Mar 2026 is -373.23% vs 11.40% in Dec 2025
Half Yearly Results Snapshot (Consolidated) - Sep'25
Growth in half year ended Sep 2025 is 25.93% vs 21.19% in Sep 2024
Growth in half year ended Sep 2025 is -27.99% vs 93.36% in Sep 2024
Nine Monthly Results Snapshot (Consolidated) - Dec'25
YoY Growth in nine months ended Dec 2025 is 0.32% vs 30.43% in Dec 2024
YoY Growth in nine months ended Dec 2025 is -24.77% vs 56.02% in Dec 2024
Annual Results Snapshot (Consolidated) - Mar'26
YoY Growth in year ended Mar 2026 is 17.29% vs 30.12% in Mar 2025
YoY Growth in year ended Mar 2026 is -96.87% vs 31.75% in Mar 2025
About Modi Rubber Ltd

Company Coordinates


