
Compare Mohit Paper Mill with Similar Stocks
Stock DNA
Paper, Forest & Jute Products
INR 39 Cr (Micro Cap)
6.00
17
0.00%
1.29
12.82%
0.73
Total Returns (Price + Dividend) 
Mohit Paper Mill for the last several years.
Risk Adjusted Returns v/s
Returns Beta

News

Mohit Paper Mills Ltd is Rated Strong Sell
Mohit Paper Mills Ltd is rated Strong Sell by MarketsMOJO, with this rating last updated on 29 May 2026. However, the analysis and financial metrics discussed here reflect the stock’s current position as of 17 July 2026, providing investors with an up-to-date view of the company’s fundamentals, valuation, financial trends, and technical outlook.
Read full news article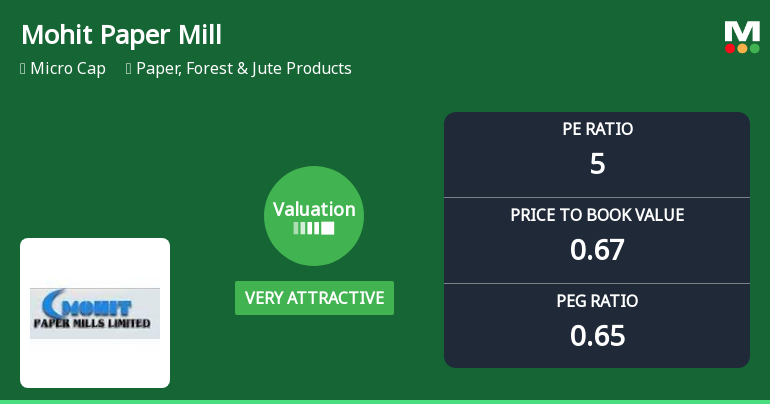
Mohit Paper Mills Ltd Valuation Shifts to Very Attractive Amidst Market Challenges
Mohit Paper Mills Ltd, a micro-cap player in the Paper, Forest & Jute Products sector, has seen its valuation parameters shift markedly towards the attractive end of the spectrum. Despite a recent downgrade to a Strong Sell rating by MarketsMOJO, the company’s price-to-earnings (P/E) and price-to-book value (P/BV) ratios now suggest compelling price attractiveness relative to peers and historical averages.
Read full news article
Mohit Paper Mills Ltd is Rated Strong Sell
Mohit Paper Mills Ltd is rated Strong Sell by MarketsMOJO. This rating was last updated on 29 May 2026. However, the analysis and financial metrics discussed below reflect the company’s current position as of 02 July 2026, providing investors with the latest insights into the stock’s fundamentals, valuation, financial trends, and technical outlook.
Read full news article Announcements
Compliances-Certificate under Reg. 74 (5) of SEBI (DP) Regulations 2018
13-Jul-2026 | Source : BSEEnclosed herein confirmation certificate under Regulation 74(5) of Securities and Exchange Board of India (Depositaries and Participants) Regulation 2018 for the quarter ending June 30 2026.
Closure of Trading Window
26-Jun-2026 | Source : BSEEnclosed herein an intimation pursuant to SEBI (Prohibition of Insider Trading) Regulations 2015 w.r.t closure of trading window which shall remain closed from 01/07/2026 till 48 hours after the declaration of unaudited financial results for the quarter ending on 30/06/2026
Notice To Shareholders W.R.T Opening Of Special Window For Transfer And Dematerialization Of Physical Securities
15-Jun-2026 | Source : BSEIn accordance with SEBI circular dated 30/01/2026 attached herein the notice to the shareholders w.r.t opening of special window for transfer and dematerialization of physical securities.
Corporate Actions

No Upcoming Board Meetings

No Dividend history available

No Splits history available

No Bonus history available

No Rights history available
Quality key factors
Valuation key factors
Technicals key factors
 Technical Indicator Scale: Bearish, Mildly Bearish, Sideways, Mildly Bullish, Bullish Turned
 Shareholding Snapshot : Jun 2026
Shareholding Compare (%holding)
Promoters
None
Held by 0 Schemes
Held by 0 FIIs
Anju Jain (21.98%)
Seltron Finance Limited (9.96%)
22.09%
Quarterly Results Snapshot (Standalone) - Mar'26 - QoQ

QoQ Growth in quarter ended Mar 2026 is 35.20% vs 2.27% in Dec 2025

QoQ Growth in quarter ended Mar 2026 is -72.76% vs 22.37% in Dec 2025
Half Yearly Results Snapshot (Standalone) - Sep'25
Growth in half year ended Sep 2025 is 16.03% vs -9.02% in Sep 2024
Growth in half year ended Sep 2025 is -4.01% vs 6.86% in Sep 2024
Nine Monthly Results Snapshot (Standalone) - Dec'25
YoY Growth in nine months ended Dec 2025 is 10.02% vs -8.77% in Dec 2024
YoY Growth in nine months ended Dec 2025 is -0.79% vs 9.72% in Dec 2024
Annual Results Snapshot (Standalone) - Mar'26
YoY Growth in year ended Mar 2026 is 11.08% vs -2.92% in Mar 2025
YoY Growth in year ended Mar 2026 is 2.00% vs 0.78% in Mar 2025
About Mohit Paper Mills Ltd

Company Coordinates


