
Compare Mohite Industrie with Similar Stocks
Dashboard
Weak Long Term Fundamental Strength with a -2.07% CAGR growth in Operating Profits over the last 5 years
- Low ability to service debt as the company has a high Debt to EBITDA ratio of 5.64 times
- The company has been able to generate a Return on Equity (avg) of 4.49% signifying low profitability per unit of shareholders funds
Flat results in Mar 26
Below par performance in long term as well as near term
Stock DNA
Garments & Apparels
INR 45 Cr (Micro Cap)
13.00
23
0.00%
0.81
3.13%
0.40
Total Returns (Price + Dividend) 
Latest dividend: 0.5000 per share ex-dividend date: Nov-25-2010
Risk Adjusted Returns v/s
Returns Beta

News
Are Mohite Industries Ltd latest results good or bad?
The latest financial results for Mohite Industries Ltd for the quarter ending March 2026 reveal significant operational challenges. The company reported net sales of ₹30.25 crores, reflecting a quarter-on-quarter decline of 34.18%, which marks its weakest revenue performance in the trailing twelve months. This decline is indicative of deteriorating demand conditions in its core textile manufacturing operations, as revenues also fell 13.72% year-on-year from ₹35.06 crores in the same quarter of the previous fiscal year. In terms of profitability, Mohite Industries experienced a net profit of ₹0.36 crores, which represents a substantial quarter-on-quarter decline of 70.97%. Despite this, the operating profit margin (excluding other income) improved to 17.12%, up from 11.27% in the previous quarter, suggesting some level of cost management efficiency. However, the profit after tax margin compressed to 1.19%, ...
Read full news article
Mohite Industries Downgraded to Strong Sell Amid Weak Fundamentals and Bearish Technicals
Mohite Industries Ltd, a micro-cap player in the Garments & Apparels sector, has been downgraded from a Sell to a Strong Sell rating as of 1 June 2026. This revision reflects deteriorating technical indicators, stagnant financial trends, weak quality metrics, and valuation concerns, signalling heightened risks for investors amid ongoing market underperformance.
Read full news article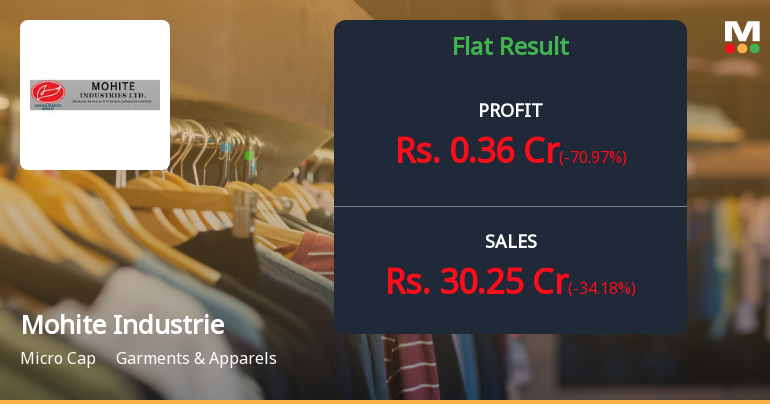
Mohite Industries Q4 FY26: Profit Plunges 70.97% as Revenue Contraction Deepens
Mohite Industries Ltd., a micro-cap textile manufacturer based in Kolhapur, Maharashtra, reported a concerning fourth quarter for FY26, with net profit collapsing 70.97% quarter-on-quarter to ₹0.36 crores from ₹1.24 crores in Q3 FY26. The sharp decline comes amid a severe revenue contraction, as net sales plummeted 34.18% sequentially to ₹30.25 crores, marking the company's weakest quarterly performance in recent periods. With a market capitalisation of just ₹48.04 crores and the stock trading at ₹2.39—down 23.40% over the past year—investors are witnessing mounting operational challenges at this Below Average quality company.
Read full news article Announcements
Announcement under Regulation 30 (LODR)-Meeting Updates
08-Jun-2026 | Source : BSEThe intimation of Adjournment of EOGM to be held on Monday 15th June 2026 at 11.00 am at Registered office of the Company.
Notice Of Adjourned EGM To Be Held On Monday 15Th June 2026
08-Jun-2026 | Source : BSENotice of Adjourned EGM to be held on Monday 15th June 2026 at 11.00 am at registered office of the Company
Shareholder Meeting / Postal Ballot-Outcome of EGM
08-Jun-2026 | Source : BSEIntimation of Adjournment of EGM to be held on Monday 15th June 2026 at 11.00 a.m. at registered office of the Company.
Corporate Actions

No Upcoming Board Meetings

Mohite Industries Ltd has declared 5% dividend, ex-date: 25 Nov 10

Mohite Industries Ltd has announced 1:10 stock split, ex-date: 31 Jan 25

No Bonus history available

No Rights history available
Quality key factors
Valuation key factors
Technicals key factors
 Technical Indicator Scale: Bearish, Mildly Bearish, Sideways, Mildly Bullish, Bullish Turned
 Shareholding Snapshot : Mar 2026
Shareholding Compare (%holding)
Promoters
6.6338
Held by 0 Schemes
Held by 0 FIIs
Mohite Shivaji Ramchandra (45.65%)
None
16.36%
Quarterly Results Snapshot (Consolidated) - Mar'26 - QoQ

QoQ Growth in quarter ended Mar 2026 is -34.18% vs -11.22% in Dec 2025
QoQ Growth in quarter ended Mar 2026 is -70.97% vs -59.21% in Dec 2025
Half Yearly Results Snapshot (Consolidated) - Sep'25
Growth in half year ended Sep 2025 is -18.28% vs 129.13% in Sep 2024
Growth in half year ended Sep 2025 is -57.71% vs 209.68% in Sep 2024
Nine Monthly Results Snapshot (Consolidated) - Dec'25
YoY Growth in nine months ended Dec 2025 is -6.53% vs 108.67% in Dec 2024
YoY Growth in nine months ended Dec 2025 is -43.72% vs 187.62% in Dec 2024
Annual Results Snapshot (Consolidated) - Mar'26
YoY Growth in year ended Mar 2026 is -8.04% vs 33.40% in Mar 2025
YoY Growth in year ended Mar 2026 is -32.08% vs 126.81% in Mar 2025
About Mohite Industries Ltd

Company Coordinates


