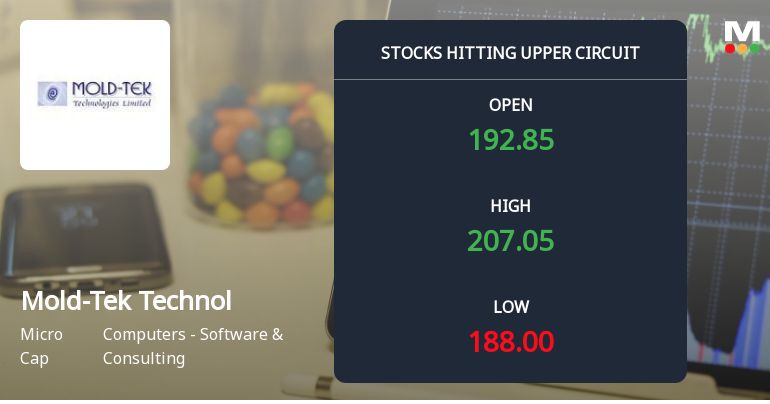
Mold-Tek Technol

  • Market Cap: Micro Cap
  • Industry: Computers - Software & Consulting
  • ISIN: INE835B01035
  • NSEID: MOLDTECH
  • BSEID: 526263
INR
120.71
0.29 (0.24%)
BSENSE

May 27

BSE+NSE Vol: 23.52 k

  • Price Points
  • Score
  • Mojo Parameters
  • Total Return
  • News and Corporate Actions
  • Key factors
  • Shareholding
  • Financials
  • CompanyCV
stock-summaryPrice Point
High/Low

1Day

52 Week

Valuation
Technical
Day's Volume

CASH

23.52 k (-35.60%) Volume

Shareholding (Mar 2026)

FII

0.01%

Held by 2 FIIs

DII

0.48%

Held by 0 DIIs

Promoter

49.85%

how big is Mold-Tek Technol?

06-Jun-2025

As of Jun 06, Mold-Tek Technologies Ltd has a market capitalization of 400.54 Cr and reported net sales of 145.85 Cr and net profit of 12.16 Cr over the latest four quarters. Shareholder's funds are 121.65 Cr, with total assets of 145.70 Cr as of Mar'24.

Market Cap: As of Jun 06, Mold-Tek Technologies Ltd has a market capitalization of 400.54 Cr, classified as a Micro Cap.<BR><BR>Recent Quarterly Performance: The sum of Net Sales for the latest 4 quarters, which includes data from Mar'25, Dec'24, Sep'24, and Jun'24, is 145.85 Cr. The sum of Net Profit for the same period is 12.16 Cr. This data is Consolidated.<BR><BR>Balance Sheet Snapshot: This is Consolidated data for the latest annual period ending in Mar'24. The Shareholder's Funds are reported at 121.65 Cr, while Total Assets amount to 145.70 Cr.

View full answer

Who are the top shareholders of the Mold-Tek Technol?

06-Jun-2025

The top shareholders of Mold-Tek Technol include Mold Tek Packaging Limited with 7.41%, Shubhi Consultancy Services LLP at 2.27%, and individual investors collectively owning 40.21%. There are no pledged promoter holdings or mutual fund schemes associated with the company.

The top shareholders of Mold-Tek Technol include Mold Tek Packaging Limited, which holds the largest stake at 7.41%. Additionally, Shubhi Consultancy Services LLP is the highest public shareholder with a holding of 2.27%. Individual investors collectively own 40.21% of the company. There are also four foreign institutional investors (FIIs) that hold a small percentage of 0.02%. Notably, there are no pledged promoter holdings or mutual fund schemes involved with the company.

View full answer

Has Mold-Tek Technol declared dividend?

06-Jun-2025

Mold-Tek Technologies Ltd has declared a 70% dividend, amounting to ₹1.4 per share, with an ex-date of September 19, 2024. Despite the recent volatility and negative total returns in shorter periods, the company has shown strong positive returns over the longer term.

Mold-Tek Technologies Ltd has declared a 70% dividend.<BR><BR>Dividend Details:<BR>- Percentage announced: 70%<BR>- Amount per share: 1.4<BR>- Ex-date: 19 Sep 24<BR><BR>Dividend Yield: 1.03%.<BR><BR>Total Returns by Period:<BR>In the last 6 months, the price return was -36.21%, the dividend return was 0%, resulting in a total return of -36.21%.<BR><BR>Over the past year, the price return was -42.78%, the dividend return was 0.53%, leading to a total return of -42.25%.<BR><BR>In the 2-year period, the price return was -59.13%, the dividend return was 1.51%, which culminated in a total return of -57.62%.<BR><BR>For the 3-year period, the price return was 34.93%, the dividend return was 7.93%, resulting in a total return of 42.86%.<BR><BR>In the last 4 years, the price return was 132.63%, the dividend return was 14.29%, leading to a total return of 146.92%.<BR><BR>Over the 5-year period, the price return was 258.29%, the dividend return was 28.33%, resulting in a total return of 286.62%.<BR><BR>Overall, while Mold-Tek Technologies Ltd has declared a dividend, the recent total returns indicate significant volatility, with negative returns in shorter periods but strong positive returns over the longer term. The dividend yield is modest, reflecting the company's performance in the context of its stock price fluctuations.

View full answer

Who are the peers of the Mold-Tek Technol?

03-Jun-2025

Mold-Tek Technol's peers include TCS, Infosys, HCL Technologies, Wipro, Tech Mahindra, Trejhara Solutio, Softsol India, Airan, and Systango Tech. Mold-Tek Technol has a Good management risk rating but the lowest 1-year return at -44.81% among its peers.

Peers: The peers of Mold-Tek Technol are TCS, Infosys, HCL Technologies, Wipro, Tech Mahindra, Trejhara Solutio, Softsol India, Airan, Systango Tech.<BR><BR>Quality Snapshot: Excellent management risk is observed at TCS, Infosys, and HCL Technologies, while Good management risk is found at Wipro, Tech Mahindra, Mold-Tek Technol, and Systango Tech. Below Average management risk is noted at Trejhara Solutio, Softsol India, and Pelatro, while Average management risk is seen at Airan. Growth is rated as Good for TCS and Infosys, Average for HCL Technologies, and Below Average for Wipro, Tech Mahindra, Mold-Tek Technol, Trejhara Solutio, Softsol India, and Airan, while Systango Tech has Excellent growth. Capital Structure is rated Excellent for TCS, Infosys, HCL Technologies, Wipro, Tech Mahindra, Mold-Tek Technol, and Airan, while Trejhara Solutio has Good capital structure, and Softsol India, Systango Tech, and Pelatro have Below Average.<BR><BR>Return Snapshot: Trejhara Solutio has the highest 1-year return at 53.38%, while Mold-Tek Technol has the lowest at -44.81%, indicating a significant negative performance compared to its peers. Additionally, the six-month return is negative for Mold-Tek Technol, TCS, Wipro, Tech Mahindra, and Softsol India.

View full answer

Who are in the management team of Mold-Tek Technol?

16-Jul-2025

As of March 2022, the management team of Mold-Tek Technol includes J Lakshmana Rao (Chairman & Managing Director), J Sudharani (Whole-time Director), and several non-executive and independent directors, totaling nine members. This diverse team oversees the company's governance and management.

As of March 2022, the management team of Mold-Tek Technol includes the following individuals:<BR><BR>1. J Lakshmana Rao - Chairman & Managing Director<BR>2. A Subrahmanyam - Non Executive Director<BR>3. P Venkateswara Rao - Non Executive Director<BR>4. K Venkata Appa Rao - Independent Director<BR>5. C Vasanth Kumar Roy - Independent Director<BR>6. J Sudharani - Whole-time Director<BR>7. Bhujanga Rao Janumahanti - Non Executive Director<BR>8. Dhanraj Tirumala Narasimha Rao Togaru - Independent Director<BR>9. Madhuri Venkata Ramani Viswanadham - Independent Director<BR><BR>This team comprises a mix of executive and non-executive directors, with various roles contributing to the governance and management of the company.

View full answer

What does Mold-Tek Technol do?

17-Jul-2025

Mold-Tek Technologies Ltd is an Indian manufacturer of injection and blow moulded plastic items, classified as a micro-cap company. As of March 2025, it reported net sales of ₹299 Cr and a net loss of ₹16 Cr, with a market cap of ₹458 Cr.

Overview:<BR>Mold-Tek Technologies Ltd is a leading manufacturer of injection and blow moulded plastic items in India, operating within the Computers - Software & Consulting industry and classified as a micro-cap company.<BR><BR>History:<BR>The company was incorporated in July 1985, previously known as Mold-Tek Plastics Limited. It has undergone a rights issue in August 1995 to expand its plastic moulding capacity and PET container manufacturing facility. The latest quarterly results reported net sales and profit for March 2025.<BR><BR>Financial Snapshot:<BR>Net Sales: 299 Cr (Quarterly Results - Mar 2025) <BR>Net Profit: -16 Cr (Quarterly Results - Mar 2025) <BR>Market Cap: INR 458 Cr (Micro Cap)<BR><BR>Key Metrics:<BR>P/E: 37.00 <BR>Industry P/E: 33 <BR>Dividend Yield: 0.87% <BR>Debt Equity: -0.06 <BR>Return on Equity: 10.33% <BR>Price to Book: 3.91 <BR><BR>Contact Details:<BR>Address: 700 Road No 36, Jubilee Hills Hyderabad Telangana : 500033 <BR>Tel: 91-40-4030 0300/01/02/03/04 <BR>Email: ir@moldtekindia.com <BR>Website: http://www.moldtekgroup, moldtekindia.com

View full answer

Is Mold-Tek Technol technically bullish or bearish?

06-Nov-2025

As of November 4, 2025, the trend is mildly bullish with supportive indicators like a bullish MACD and moving average, but caution is advised due to a bearish KST signal and lack of momentum from the RSI.

As of 4 November 2025, the technical trend has changed from bullish to mildly bullish. The current stance is mildly bullish, supported by a bullish MACD on the weekly chart and a bullish moving average on the daily chart. The Bollinger Bands also indicate a mildly bullish trend on both weekly and monthly time frames. However, the KST shows a bearish signal on the monthly, which slightly offsets the overall bullish sentiment. The RSI indicates no signal on both weekly and monthly charts, suggesting a lack of momentum. Overall, while the indicators lean towards a mildly bullish outlook, the mixed signals, particularly from the KST, suggest caution.

View full answer

Is Mold-Tek Technol overvalued or undervalued?

18-Nov-2025

As of November 17, 2025, Mold-Tek Technologies is considered overvalued with a risky valuation grade, reflected by a PE ratio of 180.78, an EV to EBITDA of 112.00, and poor stock performance, contrasting with its peers and the overall market.

As of 17 November 2025, Mold-Tek Technologies has moved from an expensive to a risky valuation grade. The company is currently considered overvalued. Key ratios indicate significant concerns, with a PE ratio of 180.78, an EV to EBITDA of 112.00, and a Price to Book Value of 4.45. <BR><BR>In comparison to its peers, Mold-Tek's PE ratio is substantially higher than Rail Vikas at 60.05 and Craftsman Auto at 61.67, both of which are classified as fair or expensive. Additionally, the company's recent stock performance has been underwhelming, with a year-to-date return of -7.68%, contrasting sharply with the Sensex's gain of 8.72% during the same period. This further reinforces the view that Mold-Tek is overvalued in the current market environment.

View full answer

How has been the historical performance of Mold-Tek Technol?

02-Dec-2025

Mold-Tek Technol experienced a decline in key financial metrics from March 2024 to March 2025, with net sales dropping from 160.74 Cr to 145.85 Cr, and profit after tax decreasing from 27.85 Cr to 12.17 Cr, indicating a challenging year for the company. Total assets and cash flow from operating activities also fell during this period.

Answer:<BR>The historical performance of Mold-Tek Technol shows fluctuations in key financial metrics over the years, with notable changes in net sales, profits, and cash flow.<BR><BR>Breakdown:<BR>Mold-Tek Technol's net sales peaked at 160.74 Cr in March 2024 but declined to 145.85 Cr by March 2025. The total operating income followed a similar trend, decreasing from 160.74 Cr in March 2024 to 145.85 Cr in March 2025. Operating profit (PBDIT) also saw a significant drop from 44.40 Cr in March 2024 to 23.54 Cr in March 2025, reflecting a decrease in operating profit margin from 26.11% to 13.38%. Profit before tax decreased from 37.10 Cr in March 2024 to 16.32 Cr in March 2025, leading to a profit after tax of 12.17 Cr in March 2025, down from 27.85 Cr the previous year. The company’s total assets decreased from 145.70 Cr in March 2024 to 137.42 Cr in March 2025, while total liabilities also fell from 145.70 Cr to 137.42 Cr in the same period. Cash flow from operating activities decreased to 24.00 Cr in March 2025 from 32.00 Cr in March 2024, contributing to a net cash outflow of 35.00 Cr in March 2025, compared to a net inflow of 17.00 Cr the previous year. Overall, the financial performance indicates a challenging year for Mold-Tek Technol, with declines across several key metrics.

View full answer

When is the next results date for Mold-Tek Technologies Ltd?

12-May-2026

The next results date for Mold-Tek Technologies Ltd is 14 May 2026.

The next results date for Mold-Tek Technologies Ltd is scheduled for 14 May 2026.

View full answer

Are Mold-Tek Technologies Ltd latest results good or bad?

15-May-2026

Mold-Tek Technologies Ltd's latest Q4 FY26 results show strong revenue growth of 85.71% to ₹55.49 crores, but a significant 41.39% drop in net profit to ₹2.28 crores and a sharp decline in operating margins to 1.87% indicate serious profitability concerns, suggesting a cautious approach for investors.

Mold-Tek Technologies Ltd's latest results for Q4 FY26 present a mixed picture, but overall, they lean towards the negative side. While the company achieved a record revenue of ₹55.49 crores, reflecting a strong year-on-year growth of 85.71%, it faced significant challenges in profitability. The net profit dropped to ₹2.28 crores, a decline of 41.39% compared to the previous quarter, which raises concerns about the sustainability of its growth.<BR><BR>Operating margins have also taken a hit, collapsing to just 1.87% from 10.35% in the previous quarter. This sharp decrease indicates serious issues with cost management, particularly with employee expenses, which accounted for a staggering 72.51% of net sales. The reliance on other income to support profitability further complicates the picture, as it constituted a significant portion of the profit before tax.<BR><BR>In summary, while Mold-Tek Technologies has demonstrated impressive revenue growth, the substantial decline in profit margins and net profit suggests that the latest results are more concerning than positive. Investors may want to approach the stock with caution until there are signs of recovery in profitability and margin stability.

View full answer

Should I buy, sell or hold Mold-Tek Technologies Ltd?

19-May-2026

Why is Mold-Tek Technologies Ltd falling/rising?

27-May-2026

As of 26-May, Mold-Tek Technologies Ltd's stock price is rising to 120.90, with a significant intraday gain of 13.68%. Despite today's upward movement and increased trading activity, the stock has experienced substantial declines over the longer term.

As of 26-May, Mold-Tek Technologies Ltd's stock price is rising, currently at 120.90, reflecting a change of 1.0 (0.83%) upward. The stock opened with a significant gain of 13.68% today, reaching an intraday high of Rs 136.3. This upward movement is notable despite the stock's recent performance, which has shown declines over various periods, including a year-to-date drop of 19.02% and a three-year decline of 64.14%. <BR><BR>Today's trading has been characterized by high volatility, with an intraday volatility of 12.17%. Additionally, there has been a notable increase in investor participation, as evidenced by a delivery volume of 41.55k on 25 May, which rose by 95.18% compared to the five-day average. However, it is important to note that the stock is currently trading below its moving averages across multiple time frames, indicating a longer-term downward trend. <BR><BR>In summary, the stock's rise today can be attributed to a strong opening and increased trading activity, despite its overall negative performance in the longer term.

View full answer
iScoreScore
Click here to find our call on this stock
Strong Sell
Sell
Hold
Buy
Strong Buy

Dashboard

1

High Management Efficiency with a high ROE of 17.52%

 
2

The company is Net-Debt Free

 
3

Poor long term growth as Operating profit has grown by an annual rate -10.65% of over the last 5 years

 
4

Positive results in Mar 26

5

With ROE of 7.9, it has a Expensive valuation with a 2.7 Price to Book Value

6

Majority shareholders : Promoters

 
7

Consistent Underperformance against the benchmark over the last 3 years

stock-summaryMojo Parameters

Mojo Parameters

Loading Valuation Snapshot...

Stock DNA

stock-summary
Industry

Computers - Software & Consulting

stock-summary
Market cap

INR 352 Cr (Micro Cap)

stock-summary
P/E

35.00

stock-summary
Industry P/E

9

stock-summary
Dividend Yield

0.83%

stock-summary
Debt Equity

-0.16

stock-summary
Return on Equity

7.88%

stock-summary
Price to Book

2.72

Revenue and Profits:
Net Sales:
55 Cr
(Quarterly Results - Mar 2026)
Net Profit:
2 Cr
stock-summaryTotal Returns
Total Returns (Price + Dividend) stock-summary
Dividend Yield (0.83%)
TimePeriod
Price Return
Dividend Return
Total Return
3 Months
-9.51%
0%
-9.51%
6 Months
-29.42%
0%
-29.42%
1 Year
-17.71%
0.72%
-16.99%
2 Years
-51.32%
0.99%
-50.33%
3 Years
-64.07%
1.76%
-62.31%
4 Years
24.64%
8.73%
33.37%
5 Years
103.39%
17.42%
120.81%

Latest dividend: 1 per share ex-dividend date: Sep-23-2025

Risk Adjusted Returns v/s stock-summary
Returns Beta
Icon
Beta has not been calculated since enough price history is not available
stock-summaryNews & Corporate Actions

News

Announcements stock-summary

Mold-Tek Technologies Limited - Clarification - Financial Results

03-Dec-2019 | Source : NSE

Mold-Tek Technologies Limitedhnologies Limited for the quarter ended 30-Sep-2019 with respect to Regulation 33 of the SEBI (Listing Obligations and Disclosure Requirements) Regulations, 2015.

Mold-Tek Technologies Limited - Other General Purpose

15-Nov-2019 | Source : NSE

Mold-Tek Technologies Limited has informed the Exchange regarding Disclosure of Related Party Transactions for the half year ended on September 30, 2019.

Mold-Tek Technologies Limited - Outcome of Board Meeting

25-Oct-2019 | Source : NSE

Mold-Tek Technologies Limited has informed the Exchange regarding Board meeting held on October 24, 2019.

Corporate Actions stock-summary

stock-summary
BOARD MEETING

No Upcoming Board Meetings

stock-summary
DIVIDEND

Mold-Tek Technologies Ltd has declared 50% dividend, ex-date: 23 Sep 25

stock-summary
SPLITS

Mold-Tek Technologies Ltd has announced 2:10 stock split, ex-date: 17 Feb 16

stock-summary
BONUS

No Bonus history available

stock-summary
RIGHTS

No Rights history available

stock-summaryKey Factors

Quality key factors stock-summary

Factor
Value
Sales Growth (5y)
16.98%
EBIT Growth (5y)
-10.65%
EBIT to Interest (avg)
21.41
Debt to EBITDA (avg)
0.36
Net Debt to Equity (avg)
-0.16
Sales to Capital Employed (avg)
1.24
Tax Ratio
22.61%
Dividend Payout Ratio
23.48%
Pledged Shares
0
Institutional Holding
0.49%
ROCE (avg)
26.53%
ROE (avg)
17.52%

Valuation key factors

Factor
Value
P/E Ratio
35
Industry P/E
9
Price to Book Value
2.72
EV to EBIT
60.50
EV to EBITDA
28.79
EV to Capital Employed
3.04
EV to Sales
1.80
PEG Ratio
NA
Dividend Yield
0.83%
ROCE (Latest)
5.03%
ROE (Latest)
7.88%

Technicals key factors

Indicator
Weekly
Monthly
MACD
Mildly Bullish
Bearish
RSI
No Signal
No Signal
Bollinger Bands
Bearish
Bearish
Moving Averages
Bearish (Daily)
KST
Mildly Bullish
Mildly Bullish
Dow Theory
Mildly Bearish
No Trend
OBV
Mildly Bullish
Mildly Bullish
stock-summary Technical Indicator Scale: Bearish, Mildly Bearish, Sideways, Mildly Bullish, Bullish  Turned 
stock-summaryShareholding
Shareholding Snapshot : Mar 2026stock-summary
Shareholding Compare (%holding) stock-summary
Majority shareholders

Promoters

Pledged Promoter Holdings

None

Mutual Funds

Held by 0 Schemes

FIIs

Held by 2 FIIs (0.01%)

Promoter with highest holding

Mold Tek Packaging Limited (7.49%)

Highest Public shareholder

Shubhi Consultancy Services Llp (2.25%)

Individual Investors Holdings

40.01%

stock-summaryFinancial
[
  {
    "link": "quarterly",
    "btn_text": "All Quarterly Results",
    "header": "Quarterly Results Snapshot (Consolidated) - Mar'26 - QoQ",
    "rhs": [
      {
        "prefix": "Net Sales ",
        "suffix": "QoQ Growth in quarter ended Mar 2026 is 5.35% vs 30.92% in Dec 2025",
        "dir": -1
      },
      {
        "prefix": "Consolidated Net Profit ",
        "suffix": "QoQ Growth in quarter ended Mar 2026 is -41.39% vs 20.06% in Dec 2025",
        "dir": -1
      }
    ],
    "table": {
      "header": [
        "Mar'26",
        "Dec'25",
        "Change(%)"
      ],
      "body": [
        {
          "field": "Net Sales",
          "val1": "55.49",
          "val2": "52.67",
          "chgp": "5.35%",
          "chgp_class": "positive"
        },
        {
          "field": "Operating Profit (PBDIT) excl Other Income",
          "val1": "1.04",
          "val2": "5.45",
          "chgp": "-80.92%",
          "chgp_class": "negative"
        },
        {
          "field": "Interest",
          "val1": "0.26",
          "val2": "0.12",
          "chgp": "116.67%",
          "chgp_class": "negative"
        },
        {
          "field": "Exceptional Items",
          "val1": "0.00",
          "val2": "0.00",
          "chgp": "",
          "chgp_class": "neutral"
        },
        {
          "field": "Consolidate Net Profit",
          "val1": "2.28",
          "val2": "3.89",
          "chgp": "-41.39%",
          "chgp_class": "negative"
        },
        {
          "field": "Operating Profit Margin (Excl OI)",
          "val1": "1.87%",
          "val2": "10.35%",
          "chgp": "-8.48%",
          "chgp_class": "negative"
        }
      ]
    }
  },
  {
    "link": "half-yearly",
    "btn_text": "All Half Yearly Results",
    "header": "Half Yearly Results Snapshot (Consolidated) - Sep'25",
    "rhs": [
      {
        "prefix": "Net Sales ",
        "suffix": " Growth in half year ended Sep 2025 is -10.74% vs 7.32% in Sep 2024",
        "dir": -1
      },
      {
        "prefix": "Consolidated Net Profit ",
        "suffix": " Growth in half year ended Sep 2025 is -70.28% vs -8.53% in Sep 2024",
        "dir": -1
      }
    ],
    "table": {
      "header": [
        "Sep'25",
        "Sep'24",
        "Change(%)"
      ],
      "body": [
        {
          "field": "Net Sales",
          "val1": "73.52",
          "val2": "82.37",
          "chgp": "-10.74%",
          "chgp_class": "negative"
        },
        {
          "field": "Operating Profit (PBDIT) excl Other Income",
          "val1": "4.90",
          "val2": "19.81",
          "chgp": "-75.27%",
          "chgp_class": "negative"
        },
        {
          "field": "Interest",
          "val1": "0.24",
          "val2": "0.40",
          "chgp": "-40.00%",
          "chgp_class": "positive"
        },
        {
          "field": "Exceptional Items",
          "val1": "0.00",
          "val2": "0.00",
          "chgp": "",
          "chgp_class": "neutral"
        },
        {
          "field": "Consolidate Net Profit",
          "val1": "3.92",
          "val2": "13.19",
          "chgp": "-70.28%",
          "chgp_class": "negative"
        },
        {
          "field": "Operating Profit Margin (Excl OI)",
          "val1": "6.66%",
          "val2": "24.05%",
          "chgp": "-17.39%",
          "chgp_class": "negative"
        }
      ]
    }
  },
  {
    "link": "nine-monthly",
    "btn_text": "All Nine Monthly Results",
    "header": "Nine Monthly Results Snapshot (Consolidated) - Dec'25",
    "rhs": [
      {
        "prefix": "Net Sales ",
        "suffix": "YoY Growth in nine months ended Dec 2025 is 8.81% vs -2.14% in Dec 2024",
        "dir": 1
      },
      {
        "prefix": "Consolidated Net Profit ",
        "suffix": "YoY Growth in nine months ended Dec 2025 is -43.12% vs -35.93% in Dec 2024",
        "dir": -1
      }
    ],
    "table": {
      "header": [
        "Dec'25",
        "Dec'24",
        "Change(%)"
      ],
      "body": [
        {
          "field": "Net Sales",
          "val1": "126.19",
          "val2": "115.97",
          "chgp": "8.81%",
          "chgp_class": "positive"
        },
        {
          "field": "Operating Profit (PBDIT) excl Other Income",
          "val1": "10.35",
          "val2": "22.56",
          "chgp": "-54.12%",
          "chgp_class": "negative"
        },
        {
          "field": "Interest",
          "val1": "0.36",
          "val2": "0.55",
          "chgp": "-34.55%",
          "chgp_class": "positive"
        },
        {
          "field": "Exceptional Items",
          "val1": "0.00",
          "val2": "0.00",
          "chgp": "",
          "chgp_class": "neutral"
        },
        {
          "field": "Consolidate Net Profit",
          "val1": "7.81",
          "val2": "13.73",
          "chgp": "-43.12%",
          "chgp_class": "negative"
        },
        {
          "field": "Operating Profit Margin (Excl OI)",
          "val1": "8.20%",
          "val2": "19.45%",
          "chgp": "-11.25%",
          "chgp_class": "negative"
        }
      ]
    }
  },
  {
    "link": "annual",
    "btn_text": "All Annual Results",
    "header": "Annual Results Snapshot (Consolidated) - Mar'26",
    "rhs": [
      {
        "prefix": "Net Sales ",
        "suffix": "YoY Growth in year ended Mar 2026 is 24.57% vs -9.26% in Mar 2025",
        "dir": 1
      },
      {
        "prefix": "Consolidated Net Profit ",
        "suffix": "YoY Growth in year ended Mar 2026 is -17.09% vs -56.30% in Mar 2025",
        "dir": 1
      }
    ],
    "table": {
      "header": [
        "Mar'26",
        "Mar'25",
        "Change(%)"
      ],
      "body": [
        {
          "field": "Net Sales",
          "val1": "181.68",
          "val2": "145.85",
          "chgp": "24.57%",
          "chgp_class": "positive"
        },
        {
          "field": "Operating Profit (PBDIT) excl Other Income",
          "val1": "11.39",
          "val2": "19.52",
          "chgp": "-41.65%",
          "chgp_class": "negative"
        },
        {
          "field": "Interest",
          "val1": "0.63",
          "val2": "0.70",
          "chgp": "-10.00%",
          "chgp_class": "positive"
        },
        {
          "field": "Exceptional Items",
          "val1": "0.00",
          "val2": "0.00",
          "chgp": "",
          "chgp_class": "neutral"
        },
        {
          "field": "Consolidate Net Profit",
          "val1": "10.09",
          "val2": "12.17",
          "chgp": "-17.09%",
          "chgp_class": "negative"
        },
        {
          "field": "Operating Profit Margin (Excl OI)",
          "val1": "6.27%",
          "val2": "13.38%",
          "chgp": "-7.11%",
          "chgp_class": "negative"
        }
      ]
    }
  }
]

Quarterly Results Snapshot (Consolidated) - Mar'26 - QoQstock-summary

Mar'26
Dec'25
Change(%)
Net Sales
55.49
52.67
5.35%
Operating Profit (PBDIT) excl Other Income
1.04
5.45
-80.92%
Interest
0.26
0.12
116.67%
Exceptional Items
0.00
0.00
Consolidate Net Profit
2.28
3.89
-41.39%
Operating Profit Margin (Excl OI)
1.87%
10.35%
-8.48%
Values in Rs Cr.
Direction Arrows
Net Sales

QoQ Growth in quarter ended Mar 2026 is 5.35% vs 30.92% in Dec 2025

Direction Arrows
Consolidated Net Profit

QoQ Growth in quarter ended Mar 2026 is -41.39% vs 20.06% in Dec 2025

Half Yearly Results Snapshot (Consolidated) - Sep'25stock-summary

Sep'25
Sep'24
Change(%)
Net Sales
73.52
82.37
-10.74%
Operating Profit (PBDIT) excl Other Income
4.90
19.81
-75.27%
Interest
0.24
0.40
-40.00%
Exceptional Items
0.00
0.00
Consolidate Net Profit
3.92
13.19
-70.28%
Operating Profit Margin (Excl OI)
6.66%
24.05%
-17.39%
Values in Rs Cr.
Direction Arrows
Net Sales

Growth in half year ended Sep 2025 is -10.74% vs 7.32% in Sep 2024

Direction Arrows
Consolidated Net Profit

Growth in half year ended Sep 2025 is -70.28% vs -8.53% in Sep 2024

Nine Monthly Results Snapshot (Consolidated) - Dec'25stock-summary

Dec'25
Dec'24
Change(%)
Net Sales
126.19
115.97
8.81%
Operating Profit (PBDIT) excl Other Income
10.35
22.56
-54.12%
Interest
0.36
0.55
-34.55%
Exceptional Items
0.00
0.00
Consolidate Net Profit
7.81
13.73
-43.12%
Operating Profit Margin (Excl OI)
8.20%
19.45%
-11.25%
Values in Rs Cr.
Direction Arrows
Net Sales

YoY Growth in nine months ended Dec 2025 is 8.81% vs -2.14% in Dec 2024

Direction Arrows
Consolidated Net Profit

YoY Growth in nine months ended Dec 2025 is -43.12% vs -35.93% in Dec 2024

Annual Results Snapshot (Consolidated) - Mar'26stock-summary

Mar'26
Mar'25
Change(%)
Net Sales
181.68
145.85
24.57%
Operating Profit (PBDIT) excl Other Income
11.39
19.52
-41.65%
Interest
0.63
0.70
-10.00%
Exceptional Items
0.00
0.00
Consolidate Net Profit
10.09
12.17
-17.09%
Operating Profit Margin (Excl OI)
6.27%
13.38%
-7.11%
Values in Rs Cr.
Direction Arrows
Net Sales

YoY Growth in year ended Mar 2026 is 24.57% vs -9.26% in Mar 2025

Direction Arrows
Consolidated Net Profit

YoY Growth in year ended Mar 2026 is -17.09% vs -56.30% in Mar 2025

stock-summaryCompany CV
About Mold-Tek Technologies Ltd stock-summary
stock-summary
Mold-Tek Technologies Ltd
Micro Cap
Computers - Software & Consulting
Mold-Tek Technologies Limited, earlier known as Mold-Tek Plastics Limited, is one of the leading manufacturers of injection and blow moulded plastic items in India with sophisticated in-house toolroom facilities. The Company was incorporated in Jul.'85. The Company is engaged in providing Civil & Mechanical Design Engineering Services. Mold-Tek came out with a rights issue in Aug.'95 to mobilise funds to expand the plastic moulding capacity and the PET containers manufacturing facility.
Company Coordinates stock-summary
Company Details
700 Road No 36, Jubilee Hills Hyderabad Telangana : 500033
stock-summary
Tel: 91-40-4030 0300/01/02/03/04
stock-summary
ir@moldtekindia.com
Registrar Details
XL Softech Systems Ltd , 3 Sagar Society Road , No 2 Banjara Hills, Hyderabad