
Compare Mondelez International, Inc. with Similar Stocks
Dashboard
1
Company's ability to service its debt is strong with a healthy EBIT to Interest (avg) ratio of 10.38
2
Poor long term growth as Operating profit has grown by an annual rate 3.14% of over the last 5 years
3
Negative results in Jun 25
4
With ROCE of 10.76%, it has a expensive valuation with a 3.28 Enterprise value to Capital Employed
5
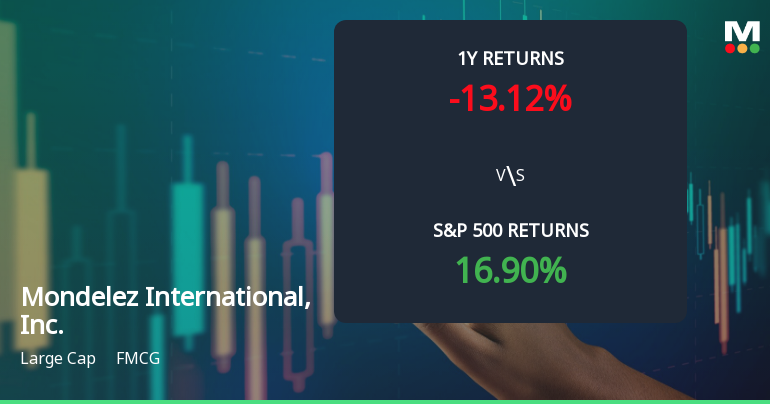
Consistent Underperformance against the benchmark over the last 3 years
Total Returns (Price + Dividend) 
TimePeriod
Price Return
Dividend Return
Total Return
3 Months
-15.51%
0%
-15.51%
6 Months
-6.75%
0%
-6.75%
1 Year
-14.44%
0%
-14.44%
2 Years
-21.09%
0%
-21.09%
3 Years
-5.3%
0%
-5.3%
4 Years
-9.51%
0%
-9.51%
5 Years
8.42%
0%
8.42%
Mondelez International, Inc. for the last several years.
Risk Adjusted Returns v/s
News
Mondelez International, Inc. Experiences Revision in Stock Evaluation Amid Mixed Market Signals
Mondelez International, Inc. has recently revised its evaluation amid mixed technical indicators. The stock is currently priced at $60.77, reflecting a year-to-date return of 1.74%. Despite challenges over the past year, the company’s market positioning shows a 52-week high of $71.15 and a low of $53.95.
Read full news article Announcements

No announcement available
Corporate Actions
No corporate action available
Quality key factors
Factor
Value
Sales Growth (5y)
7.47%
EBIT Growth (5y)
3.14%
EBIT to Interest (avg)
10.38
Debt to EBITDA (avg)
3.11
Net Debt to Equity (avg)
0.69
Sales to Capital Employed (avg)
0.76
Tax Ratio
22.26%
Dividend Payout Ratio
52.29%
Pledged Shares
0
Institutional Holding
87.77%
ROCE (avg)
10.31%
ROE (avg)
13.15%
Valuation key factors
Factor
Value
P/E Ratio
38
Industry P/E
Price to Book Value
4.87
EV to EBIT
30.48
EV to EBITDA
23.85
EV to Capital Employed
3.28
EV to Sales
3.93
PEG Ratio
NA
Dividend Yield
NA
ROCE (Latest)
10.76%
ROE (Latest)
12.81%
Technicals key factors
Indicator
Weekly
Monthly
MACD
Mildly Bullish
Bearish
RSI
No Signal
No Signal
Bollinger Bands
Mildly Bearish
Mildly Bearish
Moving Averages
Mildly Bearish (Daily)
KST
Bearish
Bearish
Dow Theory
Mildly Bullish
Mildly Bearish
OBV
No Trend
Mildly Bearish
 Technical Indicator Scale: Bearish, Mildly Bearish, Sideways, Mildly Bullish, Bullish Turned
 Shareholding Snapshot : Sep 2025
Shareholding Compare (%holding)
Majority shareholders
Domestic Funds
Domestic Funds
Held in 197 Schemes (40.74%)
Foreign Institutions
Held by 523 Foreign Institutions (17.49%)
Strategic Entities with highest holding
Highest Public shareholder
Quarterly Results Snapshot (Consolidated) - Sep'25 - YoY
Sep'25
Sep'24
Change(%)
Net Sales
9,744.00
9,204.00
5.87%
Operating Profit (PBDIT) excl Other Income
1,418.00
1,688.00
-16.00%
Interest
157.00
129.00
21.71%
Exceptional Items
-163.00
-262.00
37.79%
Consolidate Net Profit
746.00
856.00
-12.85%
Operating Profit Margin (Excl OI)
110.30%
147.00%
-3.67%
USD in Million.

Net Sales
YoY Growth in quarter ended Sep 2025 is 5.87% vs 1.94% in Sep 2024
Consolidated Net Profit
YoY Growth in quarter ended Sep 2025 is -12.85% vs -13.36% in Sep 2024
Annual Results Snapshot (Consolidated) - Dec'24
Dec'24
Dec'23
Change(%)
Net Sales
36,441.00
36,016.00
1.18%
Operating Profit (PBDIT) excl Other Income
6,632.00
6,876.00
-3.55%
Interest
508.00
550.00
-7.64%
Exceptional Items
988.00
571.00
73.03%
Consolidate Net Profit
4,623.00
4,968.00
-6.94%
Operating Profit Margin (Excl OI)
146.30%
157.20%
-1.09%
USD in Million.

Net Sales
YoY Growth in year ended Dec 2024 is 1.18% vs 14.35% in Dec 2023
Consolidated Net Profit
YoY Growth in year ended Dec 2024 is -6.94% vs 82.25% in Dec 2023
About Mondelez International, Inc.

Mondelez International, Inc.
FMCG
Mondelez International, Inc. is a snack company. The Company manufactures and markets snack food and beverage products for consumers. It operates through four segments: Latin America, Asia, Middle East, and Africa (AMEA), Europe and North America. Its brands spanned five product categories: Biscuits, including cookies, crackers and salted snacks; Chocolate; Gum and candy; Beverages, including coffee and powdered beverages, and Cheese and grocery. Its portfolio includes various snack brands, including Nabisco, Oreo, LU and belVita biscuits; Cadbury, Milka, Cadbury Dairy Milk and Toblerone chocolate; Trident gum; Halls candy, and Tang powdered beverages. The Company sells its products to supermarket chains, wholesalers, supercenters, club stores, mass merchandisers, distributors, convenience stores, gasoline stations, drug stores, value stores and retail food outlets.
Company Coordinates
Company Details
905 West Fulton Market, Suite 200 , CHICAGO IL : 60607


Registrar Details
InfinHub Market Technologies FZ-LLC, Building-2, Unit 112, Dubai Internet City, Dubai, United Arab Emirates
GET THE MARKETSMOJO APP


Company
Stocks
Portfolio


"Investment in securities markets are subject to market risk. Read all the related documents carefully before investing."