
Compare Monolithisch Ind with Similar Stocks
Dashboard
Company has a Debt to Equity ratio (avg) of 0.20 times
Healthy long term growth as Net Sales has grown by an annual rate of 52.50% and Operating profit at 74.92%
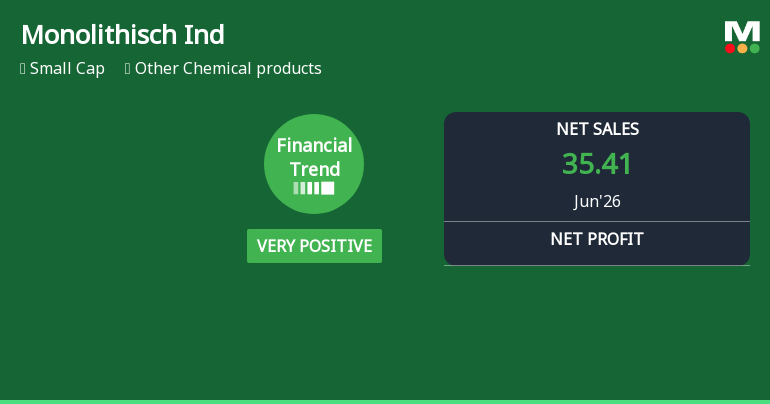
With a growth in Net Profit of 24.28%, the company declared Very Positive results in Jun 26
Increasing Participation by Institutional Investors
Stock DNA
Other Chemical products
INR 1,765 Cr (Small Cap)
73.00
46
0.00%
-0.18
15.26%
13.25
Total Returns (Price + Dividend) 
Monolithisch Ind for the last several years.
Risk Adjusted Returns v/s
Returns Beta

News
Monolithisch India Ltd Reports Strongest Quarterly Performance, Upgrades to Buy
Monolithisch India Ltd has delivered a standout quarterly performance in June 2026, registering its highest-ever revenue and profit metrics, prompting an upgrade in its investment rating from Hold to Buy. The company’s financial trend has shifted markedly from flat to very positive, reflecting strong operational execution and favourable market conditions within the Other Chemical products sector.
Read full news article
Monolithisch India Ltd Hits All-Time High of Rs 827.9 as Momentum Builds Across Timeframes
Extending its remarkable rally, Monolithisch India Ltd surged 4.67% on 27 Jul 2026 to touch a fresh all-time high of Rs 827.9, significantly outpacing the Sensex which gained a modest 0.72% on the same day.
Read full news article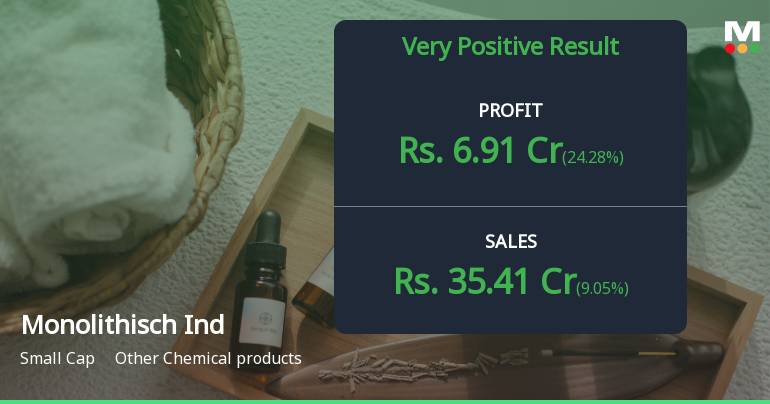
Monolithisch India Q1 FY27: Stellar 135% Profit Surge Powers Small-Cap Chemical Stock to New Heights
Monolithisch India Ltd., a small-cap player in the speciality chemicals sector with a market capitalisation of ₹1,750 crores, delivered a blockbuster performance in Q1 FY27, posting net profit of ₹10.07 crores—a remarkable 134.73% year-on-year surge that significantly outpaced revenue growth. The stock responded enthusiastically, rallying 5.43% on the day of this analysis to ₹816.80, extending its extraordinary one-year gain of 94.94% and significantly outperforming the Sensex's negative 5.91% return over the same period.
Read full news article Announcements
Corporate Actions

No Upcoming Board Meetings

No Dividend history available

No Splits history available

No Bonus history available

No Rights history available
Quality key factors
Valuation key factors
Technicals key factors
 Technical Indicator Scale: Bearish, Mildly Bearish, Sideways, Mildly Bullish, Bullish Turned
 Shareholding Snapshot : Jun 2026
Shareholding Compare (%holding)
Promoters
None
Held by 0 Schemes
Held by 7 FIIs (1.79%)
Kargil Transport Private Limited (64.04%)
Mukul Mahavir Agrawal (2.76%)
16.86%
Quarterly Results Snapshot (Standalone) - Jun'26 - QoQ

QoQ Growth in quarter ended Jun 2026 is 9.05% vs 5.52% in Mar 2026
QoQ Growth in quarter ended Jun 2026 is 24.28% vs 12.10% in Mar 2026
Half Yearly Results Snapshot (Consolidated) - Mar'26
Growth in half year ended Mar 2026 is 36.19% vs 1.65% in Sep 2025
Growth in half year ended Mar 2026 is 60.23% vs 1.14% in Sep 2025
Nine Monthly Results Snapshot (Standalone) - Dec'25
Not Applicable: The company has declared_date for only one period
Not Applicable: The company has declared_date for only one period
Annual Results Snapshot (Standalone) - Mar'26

YoY Growth in year ended Mar 2026 is 23.81% vs 41.30% in Mar 2025
YoY Growth in year ended Mar 2026 is 35.03% vs 68.74% in Mar 2025
About Monolithisch India Ltd

Company Coordinates


