
Compare Monotype India with Similar Stocks
Dashboard
With a Negative Book Value, the company has a Weak Long Term Fundamental Strength
- Poor long term growth as Net Sales has grown by an annual rate of -100.00% and Operating profit at 0% over the last 5 years
- The company has a negative book value of Rs 2.23 crore
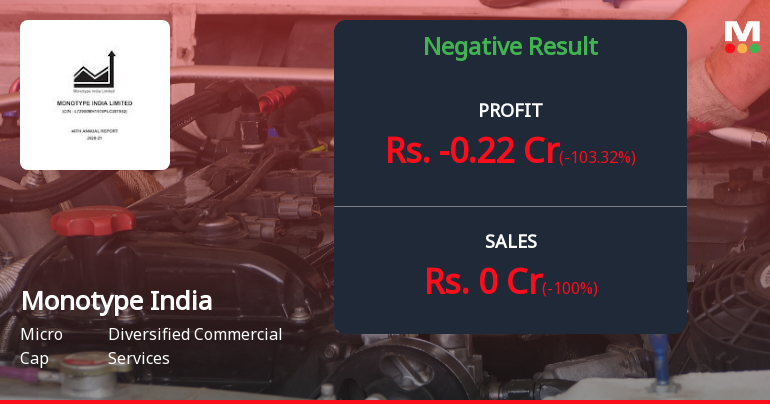
Negative results in Mar 26
Risky - Negative EBITDA
Stock DNA
Diversified Commercial Services
INR 28 Cr (Micro Cap)
4.00
20
0.00%
-4.29
-280.72%
-12.61
Total Returns (Price + Dividend) 
Monotype India for the last several years.
Risk Adjusted Returns v/s
Returns Beta

News
Monotype India Q4 FY26: Revenue Collapse Sends Stock into Freefall
Monotype India Ltd. reported catastrophic results for Q4 FY26, with the company posting zero revenue and slipping into losses, marking a dramatic reversal from the profitable performance witnessed in the previous year. The micro-cap diversified commercial services company, with a market capitalisation of just ₹31.00 crores, reported a net loss of ₹0.22 crores for the quarter ended March 2026, compared to a profit of ₹6.63 crores in Q4 FY25. The stock has plummeted 39.44% over the past year, currently trading at ₹0.43, significantly below its 52-week high of ₹0.82.
Read full news article
Monotype India Ltd is Rated Strong Sell
Monotype India Ltd is rated Strong Sell by MarketsMOJO, with this rating last updated on 11 Jul 2025. However, the analysis and financial metrics discussed here reflect the stock's current position as of 28 May 2026, providing investors with an up-to-date view of the company’s fundamentals, valuation, financial trends, and technical outlook.
Read full news article Announcements
Disclosures under Reg. 29(2) of SEBI (SAST) Regulations 2011
05-Jun-2026 | Source : BSEThe Exchange has received the disclosure under Regulation 29(2) of SEBI (Substantial Acquisition of Shares & Takeovers) Regulations 2011 for Sandeep Ispat Trader LLP
Disclosures under Reg. 29(2) of SEBI (SAST) Regulations 2011
05-Jun-2026 | Source : BSEThe Exchange has received the disclosure under Regulation 29(2) of SEBI (Substantial Acquisition of Shares & Takeovers) Regulations 2011 for Sandeep Ispat Trader LLP
Disclosures under Reg. 29(2) of SEBI (SAST) Regulations 2011
05-Jun-2026 | Source : BSEThe Exchange has received the disclosure under Regulation 29(2) of SEBI (Substantial Acquisition of Shares & Takeovers) Regulations 2011 for Sandeep Ispat Trader LLP
Corporate Actions

No Upcoming Board Meetings

No Dividend history available

Monotype India Ltd has announced 1:10 stock split, ex-date: 16 Mar 15

No Bonus history available

No Rights history available
Quality key factors
Valuation key factors
Technicals key factors
 Technical Indicator Scale: Bearish, Mildly Bearish, Sideways, Mildly Bullish, Bullish Turned
 Shareholding Snapshot : Mar 2026
Shareholding Compare (%holding)
Non Institution
None
Held by 0 Schemes
Held by 0 FIIs
Innocent Investment Consultants Llp (6.76%)
Vedant Commodeal Private Limited (3.91%)
75.16%
Quarterly Results Snapshot (Standalone) - Mar'26 - YoY

YoY Growth in quarter ended Mar 2026 is -100.00% vs 455.33% in Mar 2025
YoY Growth in quarter ended Mar 2026 is -103.32% vs 223.41% in Mar 2025
Half Yearly Results Snapshot (Standalone) - Sep'25
Growth in half year ended Sep 2025 is -100.00% vs 1,202.79% in Sep 2024
Growth in half year ended Sep 2025 is -105.74% vs -31.94% in Sep 2024
Nine Monthly Results Snapshot (Standalone) - Dec'25
YoY Growth in nine months ended Dec 2025 is -100.00% vs 2,152.56% in Dec 2024
YoY Growth in nine months ended Dec 2025 is -106.06% vs -17.73% in Dec 2024
Annual Results Snapshot (Standalone) - Mar'26
YoY Growth in year ended Mar 2026 is -100.00% vs 1,253.06% in Mar 2025
YoY Growth in year ended Mar 2026 is -104.70% vs 35.49% in Mar 2025
About Monotype India Ltd

Company Coordinates


