
Compare Monte Carlo Fas. with Similar Stocks
Dashboard
Weak Long Term Fundamental Strength with a -5.53% CAGR growth in Operating Profits over the last 5 years
- Low ability to service debt as the company has a high Debt to EBITDA ratio of 2.82 times
- The company has been able to generate a Return on Capital Employed (avg) of 9.76% signifying low profitability per unit of total capital (equity and debt)
Flat results in Dec 25
Despite the size of the company, domestic mutual funds hold only 0% of the company
Stock DNA
Garments & Apparels
INR 1,046 Cr (Micro Cap)
10.00
42
4.13%
0.67
10.36%
1.26
Total Returns (Price + Dividend) 
Latest dividend: 20 per share ex-dividend date: Sep-22-2025
Risk Adjusted Returns v/s
Returns Beta

News
Monte Carlo Fashions Ltd Falls to 52-Week Low of Rs 489 as Sell-Off Deepens
A sharp decline over the past two sessions has dragged Monte Carlo Fashions Ltd to a fresh 52-week low of Rs 489 on 27 Mar 2026, marking a 43.5% drop from its peak of Rs 865 within the last year. This fall comes amid broader market weakness but also reflects company-specific pressures that have weighed heavily on investor sentiment.
Read full news article
Monte Carlo Fashions Ltd is Rated Strong Sell
Monte Carlo Fashions Ltd is rated Strong Sell by MarketsMOJO, with this rating last updated on 25 February 2026. However, the analysis and financial metrics discussed here reflect the stock's current position as of 20 March 2026, providing investors with the latest insights into the company’s performance and outlook.
Read full news article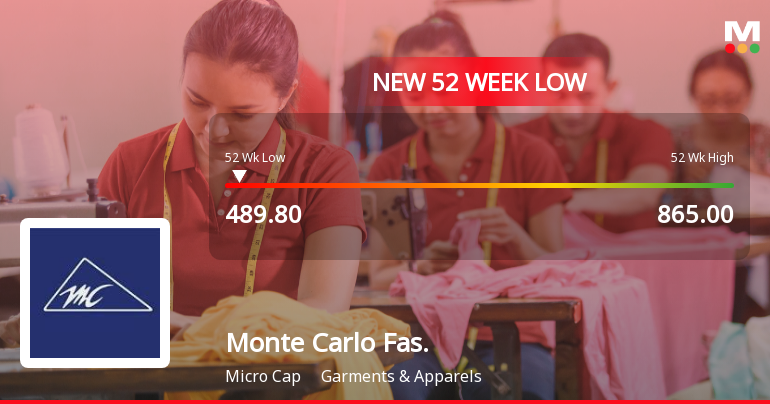
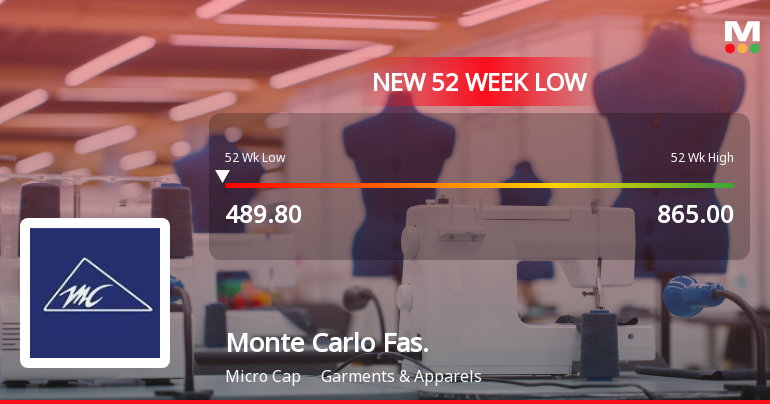
Monte Carlo Fashions Ltd Stock Hits 52-Week Low at Rs.489.8
Monte Carlo Fashions Ltd, a player in the Garments & Apparels sector, recorded a fresh 52-week low of Rs.489.8 today, marking a significant decline amid a sustained downward trend. The stock has underperformed its sector and broader market benchmarks, reflecting ongoing pressures on its valuation and financial metrics.
Read full news article Announcements
Closure of Trading Window
21-Mar-2026 | Source : BSEIntimation for Closure of Trading Window
Announcement under Regulation 30 (LODR)-Newspaper Publication
24-Feb-2026 | Source : BSENewspaper Publication regarding special window for re-lodgement of transfer request for physical shares
Announcement under Regulation 30 (LODR)-Earnings Call Transcript
31-Jan-2026 | Source : BSETranscript of Earnings Conference Call-Q3 & 9M FY26 Results
Corporate Actions

No Upcoming Board Meetings

Monte Carlo Fashions Ltd has declared 200% dividend, ex-date: 22 Sep 25

No Splits history available

No Bonus history available

No Rights history available
Quality key factors
Valuation key factors
Technicals key factors
 Technical Indicator Scale: Bearish, Mildly Bearish, Sideways, Mildly Bullish, Bullish Turned
 Shareholding Snapshot : Dec 2025
Shareholding Compare (%holding)
Promoters
None
Held by 0 Schemes
Held by 33 FIIs (1.18%)
Nagdevi Trading & Investment Co. Ltd. (24.15%)
Carnelian Structural Shift Fund (1.33%)
19.84%
Quarterly Results Snapshot (Consolidated) - Dec'25 - YoY

YoY Growth in quarter ended Dec 2025 is 10.86% vs 8.84% in Dec 2024

YoY Growth in quarter ended Dec 2025 is 10.60% vs 25.20% in Dec 2024
Half Yearly Results Snapshot (Consolidated) - Sep'25
Growth in half year ended Sep 2025 is 12.01% vs -1.57% in Sep 2024
Growth in half year ended Sep 2025 is 100.76% vs -413.17% in Sep 2024
Nine Monthly Results Snapshot (Consolidated) - Dec'25
YoY Growth in nine months ended Dec 2025 is 11.31% vs 4.57% in Dec 2024
YoY Growth in nine months ended Dec 2025 is 16.96% vs 15.92% in Dec 2024
Annual Results Snapshot (Consolidated) - Mar'25
YoY Growth in year ended Mar 2025 is 3.63% vs -4.99% in Mar 2024
YoY Growth in year ended Mar 2025 is 35.42% vs -54.77% in Mar 2024
About Monte Carlo Fashions Ltd

Company Coordinates


