
Compare Morarka Finance with Similar Stocks
Stock DNA
Non Banking Financial Company (NBFC)
INR 28 Cr (Micro Cap)
19.00
21
4.00%
0.00
1.23%
0.24
Total Returns (Price + Dividend) 
Latest dividend: 1.4767741935483871 per share ex-dividend date: Jul-08-2026
Risk Adjusted Returns v/s
Returns Beta

News
When is the next results date for Morarka Finance Ltd?
The next results date for Morarka Finance Ltd is scheduled for 21 July 2026....
Read full news article
Morarka Finance Ltd Upgraded to Sell on Valuation Improvement and Financial Trends
Morarka Finance Ltd’s investment rating has been upgraded from Strong Sell to Sell, driven primarily by a significant improvement in its valuation metrics. Despite persistent operational challenges and weak financial trends, the company’s attractive price-to-book ratio and dividend yield have prompted a reassessment of its investment appeal. This article analyses the four key parameters—Quality, Valuation, Financial Trend, and Technicals—that influenced this rating change.
Read full news article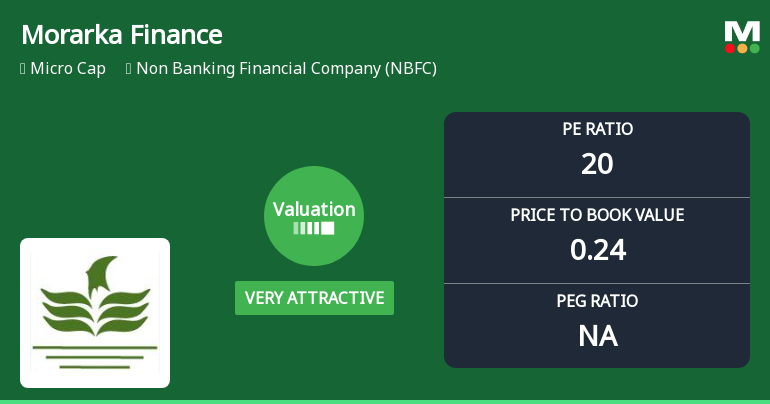
Morarka Finance Ltd Valuation Shifts to Very Attractive Amid Market Challenges
Morarka Finance Ltd, a micro-cap player in the Non Banking Financial Company (NBFC) sector, has seen a notable shift in its valuation parameters, moving from an attractive to a very attractive rating. Despite recent share price declines and underperformance relative to the Sensex, the company’s price-to-earnings (P/E) and price-to-book value (P/BV) ratios suggest a compelling valuation opportunity for investors willing to navigate its challenges.
Read full news article Announcements
Shareholder Meeting / Postal Ballot-Outcome of AGM
15-Jul-2026 | Source : BSEAs per Attachment
Shareholder Meeting / Postal Ballot-Scrutinizers Report
15-Jul-2026 | Source : BSEAs per Attachment
Announcement under Regulation 30 (LODR)-Change in Management
15-Jul-2026 | Source : BSEChange in Designation of Shri Pranay G. Morarka as the Managing Director as approved by the shareholders at the 41st Annual General Meeting.
Corporate Actions

21 Jul 2026

Morarka Finance Ltd has declared 15% dividend, ex-date: 08 Jul 26

No Splits history available

No Bonus history available

No Rights history available
Quality key factors
Valuation key factors
Technicals key factors
 Technical Indicator Scale: Bearish, Mildly Bearish, Sideways, Mildly Bullish, Bullish Turned
 Shareholding Snapshot : Jun 2026
Shareholding Compare (%holding)
Promoters
None
Held by 0 Schemes
Held by 0 FIIs
Dwarikesh Trading Company Ltd (49.08%)
Aarthi Srinivasan (3.35%)
25.98%
Quarterly Results Snapshot (Standalone) - Mar'26 - QoQ

QoQ Growth in quarter ended Mar 2026 is -76.00% vs -84.57% in Dec 2025
QoQ Growth in quarter ended Mar 2026 is 42.86% vs -93.75% in Dec 2025
Half Yearly Results Snapshot (Standalone) - Sep'25
Growth in half year ended Sep 2025 is -4.50% vs -66.83% in Sep 2024
Growth in half year ended Sep 2025 is -42.20% vs -59.70% in Sep 2024
Nine Monthly Results Snapshot (Standalone) - Dec'25
YoY Growth in nine months ended Dec 2025 is -0.46% vs -67.99% in Dec 2024
YoY Growth in nine months ended Dec 2025 is -41.41% vs -60.73% in Dec 2024
Annual Results Snapshot (Standalone) - Mar'26
YoY Growth in year ended Mar 2026 is -11.20% vs -67.02% in Mar 2025
YoY Growth in year ended Mar 2026 is -48.93% vs -55.70% in Mar 2025
About Morarka Finance Ltd

Company Coordinates


