
Compare MPL Plastics with Similar Stocks
Dashboard
With a Negative Book Value, the company has a Weak Long Term Fundamental Strength
- Poor long term growth as Net Sales has grown by an annual rate of -0.60% and Operating profit at 0% over the last 5 years
- The company has a negative book value of Rs 3.69 crore
Flat results in Mar 26
Risky - Negative EBITDA
Consistent Underperformance against the benchmark over the last 3 years
Total Returns (Price + Dividend) 
MPL Plastics for the last several years.
Risk Adjusted Returns v/s
Returns Beta

News
Are MPL Plastics Ltd latest results good or bad?
MPL Plastics Ltd's latest financial results for Q4 FY26 reveal a complex situation. The company reported a net profit of ₹0.16 crores, a notable shift from a loss of ₹0.06 crores in the previous quarter. However, this profit was primarily driven by other income of ₹0.32 crores, as the company generated zero net sales for the seventh consecutive quarter, indicating a complete operational halt. The financial data highlights that while MPL Plastics managed to report a profit, it did so against a backdrop of significant operational inactivity. The operating loss for the quarter stood at ₹0.16 crores, and the company continues to face challenges, including negative shareholder equity of ₹3.53 crores and current liabilities exceeding total assets. This situation reflects a deteriorating balance sheet, with no meaningful revenue generation since FY23. The company's performance metrics show that it has not been a...
Read full news article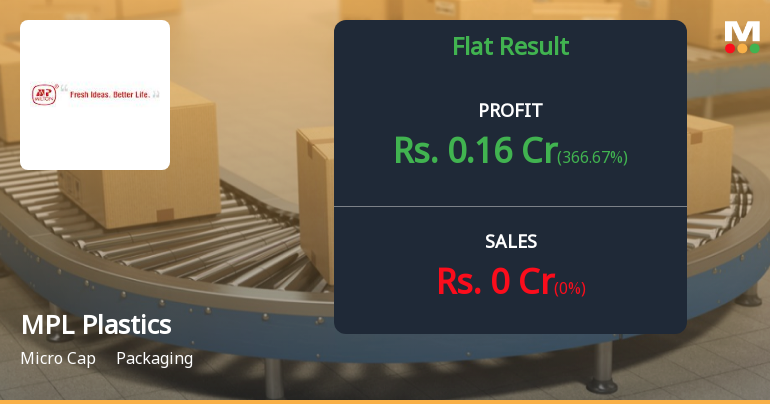
MPL Plastics Q4 FY26: Zero Revenue, Mounting Losses Signal Critical Operational Collapse
MPL Plastics Ltd., a micro-cap packaging company with a market capitalisation of just ₹8.00 crores, reported deeply troubling results for Q4 FY26, with zero revenue generation and a net profit of ₹0.16 crores driven entirely by exceptional other income. The company's stock, trading at ₹6.50, has plunged 36.59% over the past year, reflecting investor alarm over the complete cessation of core business operations and mounting financial distress.
Read full news article Announcements
Announcement under Regulation 30 (LODR)-Newspaper Publication
29-May-2026 | Source : BSENewspaper Publication of audited financial results for the quarter and year ended March 31 2026
Results - Financial Results For Quarter And Year Ended 31.03.2026
28-May-2026 | Source : BSEFinancial Results for the quarter and year ended 31.03.2026
Board Meeting Outcome for Outcome Of Board Meeting Of MPL Plastics Limited Held On 28.05.2026 For Approval Of Audited Financial Resuls For The Quarter And Year Ended 31.03.2026.
28-May-2026 | Source : BSEOutcome of Board Meeting of MPL Plastics Limited held on 28.05.2026 for approval of Audited financial resuls for the quarter and year ended 31.03.2026.
Corporate Actions

No Upcoming Board Meetings

No Dividend history available

No Splits history available

No Bonus history available

No Rights history available
Quality key factors
Valuation key factors
Technicals key factors
 Technical Indicator Scale: Bearish, Mildly Bearish, Sideways, Mildly Bullish, Bullish Turned
 Shareholding Snapshot : Mar 2026
Shareholding Compare (%holding)
Non Institution
None
Held by 4 Schemes (0.01%)
Held by 0 FIIs
Vaghani Madhup Bansilal (23.07%)
None
70.34%
Quarterly Results Snapshot (Standalone) - Mar'26 - QoQ
QoQ Growth in quarter ended Mar 2026 is 0.00% vs 0.00% in Dec 2025

QoQ Growth in quarter ended Mar 2026 is 366.67% vs 50.00% in Dec 2025
Half Yearly Results Snapshot (Standalone) - Sep'25
Growth in half year ended Sep 2025 is 0.00% vs 0.00% in Sep 2024

Growth in half year ended Sep 2025 is -42.11% vs 57.78% in Sep 2024
Nine Monthly Results Snapshot (Standalone) - Dec'25
YoY Growth in nine months ended Dec 2025 is 0.00% vs 0.00% in Dec 2024
YoY Growth in nine months ended Dec 2025 is 2.94% vs -78.95% in Dec 2024
Annual Results Snapshot (Standalone) - Mar'26
YoY Growth in year ended Mar 2026 is 0.00% vs 0.00% in Mar 2025
YoY Growth in year ended Mar 2026 is 64.58% vs -105.29% in Mar 2025
About MPL Plastics Ltd

Company Coordinates


