
Compare MRPL with Similar Stocks
Dashboard
High Management Efficiency with a high ROCE of 15.62%
Low ability to service debt as the company has a high Debt to EBITDA ratio of 2.46 times
Healthy long term growth as Net Sales has grown by an annual rate of 22.64% and Operating profit at 59.74%
The company has declared Positive results for the last 3 consecutive quarters
With ROCE of 16.3, it has a Very Attractive valuation with a 1.5 Enterprise value to Capital Employed
Increasing Participation by Institutional Investors
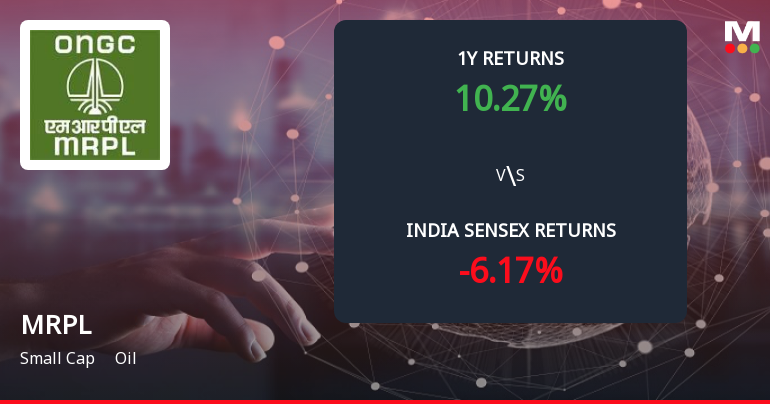
Total Returns (Price + Dividend) 
Latest dividend: 4 per share ex-dividend date: Mar-11-2026
Risk Adjusted Returns v/s
Returns Beta

News
Mangalore Refinery & Petrochemicals Ltd. Forms Death Cross, Signalling Potential Bearish Trend
Mangalore Refinery & Petrochemicals Ltd. (MRPL) has recently formed a Death Cross, a significant technical indicator where the 50-day moving average (DMA) crosses below the 200-DMA. This development signals a potential shift towards a bearish trend, raising concerns about the stock’s near-term momentum and long-term strength despite its solid fundamentals and recent upgrades.
Read full news article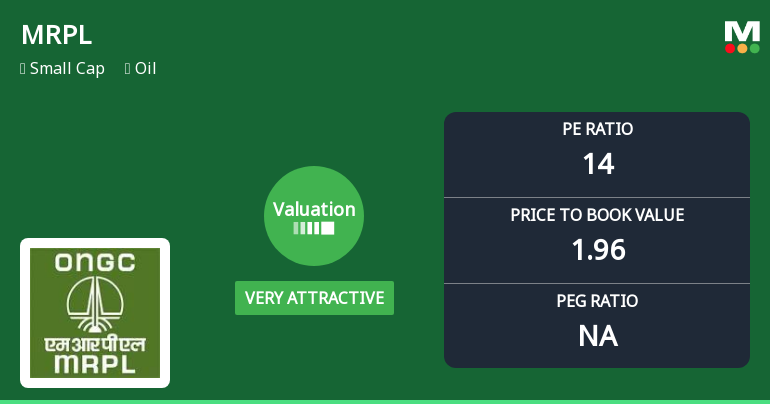
Mangalore Refinery & Petrochemicals Ltd: Valuation Shifts Signal Renewed Price Attractiveness
Mangalore Refinery & Petrochemicals Ltd. (MRPL) has seen a notable shift in its valuation parameters, moving from an attractive to a very attractive rating. This upgrade reflects improved price-to-earnings (P/E) and price-to-book value (P/BV) ratios relative to both its historical averages and peer group, signalling enhanced price attractiveness for investors amid solid operational metrics and a robust market performance.
Read full news article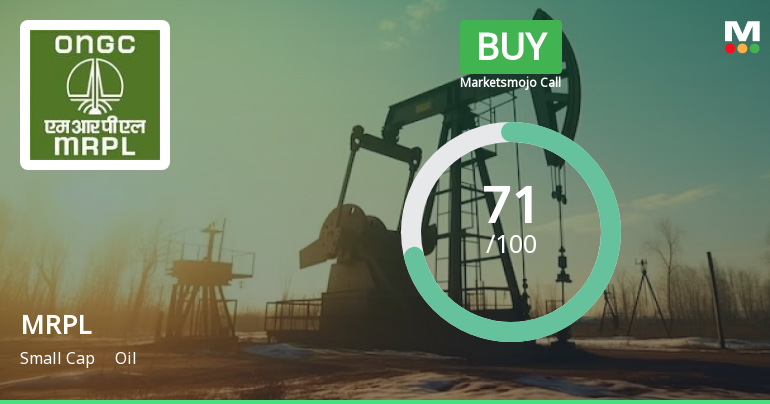
Mangalore Refinery & Petrochemicals Ltd. is Rated Buy
Mangalore Refinery & Petrochemicals Ltd. is rated Buy by MarketsMOJO, with this rating last updated on 03 June 2026. However, all fundamentals, returns, and financial metrics discussed here reflect the company’s current position as of 15 June 2026, providing investors with the latest insights into its performance and outlook.
Read full news article Announcements
Mangalore Refinery and Petrochemicals Limited - Clarification
15-Nov-2019 | Source : NSEMangalore Refinery and Petrochemicals Limited Limited with respect to announcement dated 05-Nov-2019, regarding Board meeting held on November 04, 2019. On basis of above the Company is required to clarify following: 1. Brief profile (in case of appointment)
Mangalore Refinery and Petrochemicals Limited - Outcome of Board Meeting
05-Nov-2019 | Source : NSEMangalore Refinery and Petrochemicals Limited has informed the Exchange regarding Board meeting held on November 04, 2019.
Mangalore Refinery and Petrochemicals Limited - Change in Director(s)
22-Oct-2019 | Source : NSEMangalore Refinery and Petrochemicals Limited has informed the Exchange regarding Change in Director(s) of the company.
Corporate Actions

No Upcoming Board Meetings

Mangalore Refinery & Petrochemicals Ltd. has declared 40% dividend, ex-date: 11 Mar 26

No Splits history available

No Bonus history available

No Rights history available
Quality key factors
Valuation key factors
Technicals key factors
 Technical Indicator Scale: Bearish, Mildly Bearish, Sideways, Mildly Bullish, Bullish Turned
 Shareholding Snapshot : Mar 2026
Shareholding Compare (%holding)
Promoters
None
Held by 30 Schemes (0.28%)
Held by 129 FIIs (3.41%)
Oil And Natural Gas Corporation Ltd (71.63%)
Foreign Bank - The Hongkong And Shanghai Banking Corp.ltd. (0%)
5.67%
Quarterly Results Snapshot (Consolidated) - Mar'26 - QoQ

QoQ Growth in quarter ended Mar 2026 is -3.08% vs 9.11% in Dec 2025
QoQ Growth in quarter ended Mar 2026 is -91.94% vs 131.27% in Dec 2025
Half Yearly Results Snapshot (Consolidated) - Sep'25
Growth in half year ended Sep 2025 is -17.03% vs 19.31% in Sep 2024

Growth in half year ended Sep 2025 is 157.19% vs -130.18% in Sep 2024
Nine Monthly Results Snapshot (Consolidated) - Dec'25
YoY Growth in nine months ended Dec 2025 is -7.66% vs 7.69% in Dec 2024
YoY Growth in nine months ended Dec 2025 is 674.90% vs -112.79% in Dec 2024
Annual Results Snapshot (Consolidated) - Mar'26
YoY Growth in year ended Mar 2026 is -6.35% vs 4.73% in Mar 2025
YoY Growth in year ended Mar 2026 is 3,323.91% vs -98.44% in Mar 2025
About Mangalore Refinery & Petrochemicals Ltd.

Company Coordinates


