
Key Events This Week
1 June: Stock opens strong at Rs.173.95 (+1.37%) despite Sensex decline
2 June: Mrs Bectors hits 52-week low intraday at Rs.169.25 amid market downturn
4 June: Technical momentum shifts to bearish with mixed indicator signals
5 June: Week closes at Rs.172.10, modest gain of +0.29%
Mrs Bectors Food Specialities Ltd Gains 5.67%: 3 Key Factors Driving the Week
Key Events This Week
8 Jun: New 52-week low at Rs.169
9 Jun: Technical downgrade to Sell amid bearish momentum
10 Jun: Intraday high with 7.08% surge to Rs.183.35
12 Jun: Week closes at Rs.181.85 (+5.67%)
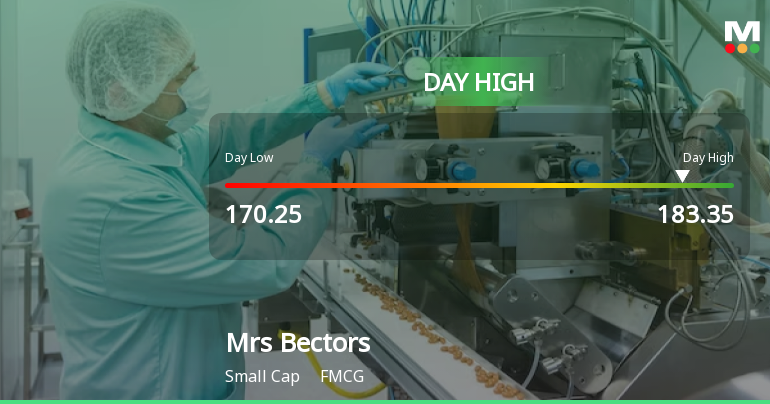
Mrs Bectors Food Specialities Ltd Surges 7.08% to Day's High of Rs 183.35 — Outperforms FMCG Sector by 5.33 Percentage Points
The Sensex advanced 0.65% on 10 Jun 2026, yet Mrs Bectors Food Specialities Ltd outpaced the broader market with a 7.08% gain, reaching an intraday high of Rs 183.35. This 5.33 percentage-point outperformance over the FMCG sector highlights a distinctly stock-specific rally rather than a market-wide lift.
Read full news article Announcements 
Announcement under Regulation 30 (LODR)-Analyst / Investor Meet - Intimation
08-Jun-2026 | Source : BSEPursuant to Regulation 30 of the Securities and Exchange Board of India (Listing Obligations and Disclosure Requirements) Regulations 2015 (SEBI LODR Regulations) the senior management of the Company will be interacting with Institutional Investors on June 11 2026 (Details as per attachment).
Announcement under Regulation 30 (LODR)-Earnings Call Transcript
02-Jun-2026 | Source : BSEPlease find enclosed herewith transcript of earnings conference call of the Company held on 29th May 2026 to discuss Q4 and FY26 results.
Announcement under Regulation 30 (LODR)-Analyst / Investor Meet - Outcome
29-May-2026 | Source : BSEPursuant to the provisions of Regulation 30 of the SEBI (Listing Obligations and Disclosure Requirement) Regulations 2015 please find below link for Audio Recording of Conference Call of the Company Mrs. Bectors Food Specialities Limited held on May 29 2026 at 12:00 P.M. (IST) to discuss the results of Q4 and FY26.
Corporate Actions

No Upcoming Board Meetings

Mrs Bectors Food Specialities Ltd has declared 30% dividend, ex-date: 17 Feb 26

Mrs Bectors Food Specialities Ltd has announced 2:10 stock split, ex-date: 12 Dec 25

No Bonus history available

No Rights history available
Quality key factors
Valuation key factors
Technicals key factors
 Technical Indicator Scale: Bearish, Mildly Bearish, Sideways, Mildly Bullish, Bullish Turned
 Shareholding Snapshot : Mar 2026
Shareholding Compare (%holding)
Promoters
None
Held by 20 Schemes (22.98%)
Held by 102 FIIs (10.4%)
Anoop Bector (20.46%)
Canara Robeco Mutual Fund A/c Canara Robeco Small Cap Fund (4.26%)
13.22%
Quarterly Results Snapshot (Consolidated) - Mar'26 - QoQ

QoQ Growth in quarter ended Mar 2026 is -8.90% vs -3.28% in Dec 2025
QoQ Growth in quarter ended Mar 2026 is -7.04% vs 4.33% in Dec 2025
Half Yearly Results Snapshot (Consolidated) - Sep'25
Growth in half year ended Sep 2025 is 9.48% vs 18.64% in Sep 2024
Growth in half year ended Sep 2025 is -9.37% vs 3.09% in Sep 2024
Nine Monthly Results Snapshot (Consolidated) - Dec'25
YoY Growth in nine months ended Dec 2025 is 9.10% vs 17.27% in Dec 2024
YoY Growth in nine months ended Dec 2025 is -3.18% vs 2.07% in Dec 2024
Annual Results Snapshot (Consolidated) - Mar'26
YoY Growth in year ended Mar 2026 is 9.06% vs 15.39% in Mar 2025
YoY Growth in year ended Mar 2026 is -1.64% vs 2.04% in Mar 2025
About Mrs Bectors Food Specialities Ltd

Company Coordinates


