
Compare MSP Steel & Pow. with Similar Stocks
Dashboard
Weak Long Term Fundamental Strength with an average Return on Capital Employed (ROCE) of 5.86%
- Poor long term growth as Net Sales has grown by an annual rate of 10.53% and Operating profit at 6.46% over the last 5 years
- Low ability to service debt as the company has a high Debt to EBITDA ratio of 1.81 times
With a growth in Net Profit of 1457.4%, the company declared Very Positive results in Mar 26
With ROCE of 9.3, it has a Fair valuation with a 2 Enterprise value to Capital Employed
71.27% of Promoter Shares are Pledged
Stock DNA
Iron & Steel Products
INR 2,407 Cr (Small Cap)
18.00
26
0.00%
0.28
13.12%
2.33
Total Returns (Price + Dividend) 
Latest dividend: 0.2 per share ex-dividend date: Sep-14-2012
Risk Adjusted Returns v/s
Returns Beta

News
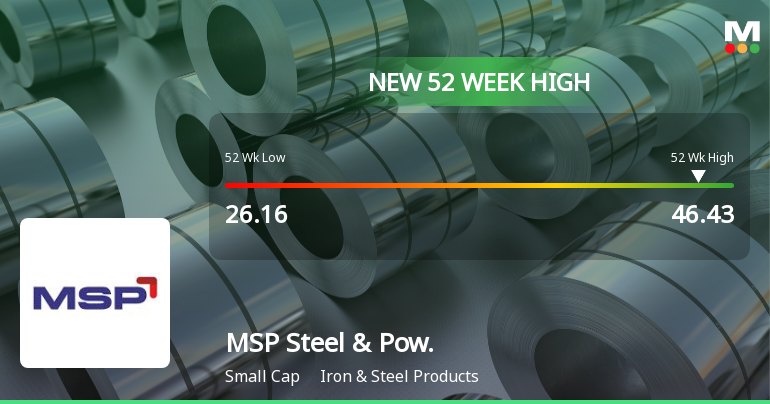
Broad-Based Technical Strength Lifts MSP Steel & Power Ltd to 52-Week High of Rs 46.43
Rising from a 52-week low of Rs 26.16 to a fresh high of Rs 46.43 on 22 Jun 2026, MSP Steel & Power Ltd has delivered a remarkable 65.87% return over the past year, significantly outperforming the Sensex, which declined by 6.42% in the same period. This surge is underpinned by a confluence of bullish technical indicators and sustained price momentum, marking a notable milestone for the small-cap iron and steel products company.
Read full news article
MSP Steel & Power Ltd is Rated Hold by MarketsMOJO
MSP Steel & Power Ltd is rated 'Hold' by MarketsMOJO, with this rating last updated on 18 May 2026. However, the analysis and financial metrics discussed here reflect the company’s current position as of 21 June 2026, providing investors with an up-to-date view of its fundamentals, returns, and market standing.
Read full news article
MSP Steel & Power Ltd Locks at Upper Circuit With 5% Gain — Buyers Queue, Sellers Absent
At Rs 44.32, the buying was done — not because demand dried up, but because the exchange wouldn't let the stock go any higher. MSP Steel & Power Ltd locked at its upper circuit of 5% on 18 Jun 2026, with buyers queuing and no sellers willing to part with shares.
Read full news article Announcements
Disclosures under Reg. 29(2) of SEBI (SAST) Regulations 2011
23-Jun-2026 | Source : BSEThe Exchange has received the disclosure under Regulation 29(2) of SEBI (Substantial Acquisition of Shares & Takeovers) Regulations 2011 for Saket Agrawal & PACs
Announcement under Regulation 30 (LODR)-Newspaper Publication
23-Jun-2026 | Source : BSESubmission of newspaper advertisement giving post intimation of the Extra ordinary General Meeting of the Company to be held on 14th July 2026 as per regulation 30 and 47 of SEBI (LODR) Regulation 2015.
Notice Of The Extra Ordinary General Meeting (EGM)
22-Jun-2026 | Source : BSENotice of EGM dated 14th July 2026
Corporate Actions

No Upcoming Board Meetings

MSP Steel & Power Ltd has declared 2% dividend, ex-date: 14 Sep 12

No Splits history available

No Bonus history available

No Rights history available
Quality key factors
Valuation key factors
Technicals key factors
 Technical Indicator Scale: Bearish, Mildly Bearish, Sideways, Mildly Bullish, Bullish Turned
 Shareholding Snapshot : Mar 2026
Shareholding Compare (%holding)
Non Institution
71.2719
Held by 0 Schemes
Held by 7 FIIs (0.12%)
Jagran Vyapaar Pvt. Ltd. (7.58%)
Tarini Mata Properties Private Limited (9.47%)
14.04%
Quarterly Results Snapshot (Consolidated) - Mar'26 - QoQ

QoQ Growth in quarter ended Mar 2026 is 27.77% vs -5.61% in Dec 2025
QoQ Growth in quarter ended Mar 2026 is 1,451.91% vs 107.34% in Dec 2025
Half Yearly Results Snapshot (Consolidated) - Sep'25

Growth in half year ended Sep 2025 is -2.84% vs 6.20% in Sep 2024
Growth in half year ended Sep 2025 is -1,969.82% vs 20.29% in Sep 2024
Nine Monthly Results Snapshot (Consolidated) - Dec'25
YoY Growth in nine months ended Dec 2025 is -5.52% vs 0.91% in Dec 2024
YoY Growth in nine months ended Dec 2025 is -1,040.22% vs 311.28% in Dec 2024
Annual Results Snapshot (Consolidated) - Mar'26
YoY Growth in year ended Mar 2026 is -2.14% vs 1.09% in Mar 2025
YoY Growth in year ended Mar 2026 is 219.12% vs -297.42% in Mar 2025
About MSP Steel & Power Ltd

Company Coordinates


