
Compare MT Educare with Similar Stocks
Dashboard
With a Negative Book Value, the company has a Weak Long Term Fundamental Strength
- Company's ability to service its debt is weak with a poor EBIT to Interest (avg) ratio of -1.95
- The company has been able to generate a Return on Equity (avg) of 0.83% signifying low profitability per unit of shareholders funds
Flat results in Mar 26
Risky - Negative Operating Profits
89.61% of Promoter Shares are Pledged
Consistent Underperformance against the benchmark over the last 3 years
Stock DNA
Other Consumer Services
INR 14 Cr (Micro Cap)
NA (Loss Making)
NA
0.00%
-24.71
60.78%
-2.92
Total Returns (Price + Dividend) 
Latest dividend: 1.4 per share ex-dividend date: Sep-20-2016
Risk Adjusted Returns v/s
Returns Beta

News
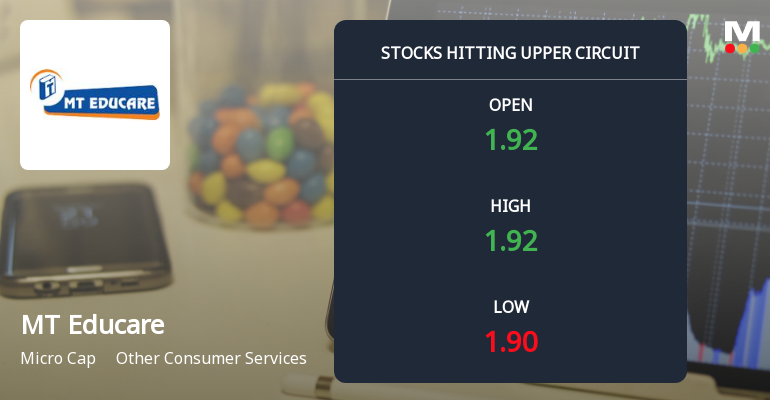
MT Educare Ltd Locks at Upper Circuit With 4.92% Gain — Buyers Queue, Sellers Absent
At Rs 1.92, the buying was done — not because demand dried up, but because the exchange wouldn't let the stock go any higher. MT Educare Ltd locked at its upper circuit of 4.92% on 09 Jul 2026, with buyers queuing and no sellers willing to part with shares.
Read full news article
MT Educare Ltd Forms Golden Cross Amid Mixed Technical Signals and Micro-Cap Challenges
The 50-day moving average for MT Educare Ltd has crossed above the 200-day moving average, creating a golden cross on 08 Jul 2026. Yet, this technical milestone arrives amid a complex backdrop of mixed momentum indicators and micro-cap liquidity concerns, raising questions about the signal's reliability.
Read full news article
MT Educare Ltd Locks at Lower Circuit With 5% Loss — Sellers Queue, No Buyers in Sight
At Rs 1.83, sellers were still queuing — but there were no buyers willing to take the other side. MT Educare Ltd locked at its lower circuit of 5% on 07 Jul 2026, with unfilled sell orders and a frozen price, signalling a pronounced imbalance between supply and demand.
Read full news article Announcements
MT Educare Limited - Analysts/Institutional Investor Meet/Con. Call Updates
22-Nov-2019 | Source : NSEMT Educare Limited has informed the Exchange regarding Analysts/Institutional Investor Meet/Con. Call Updates
MT Educare Limited - Outcome of Board Meeting
15-Nov-2019 | Source : NSEMT Educare Limited has informed the Exchange regarding Board meeting held on November 14, 2019.
MT Educare Limited - Updates
04-Nov-2019 | Source : NSEMT Educare Limited has informed the Exchange regarding 'Intimation under Regulation 30 of the SEBI (Listing Obligations and Disclosure Requirements), Regulations, 2015'.
Corporate Actions

No Upcoming Board Meetings

MT Educare Ltd has declared 14% dividend, ex-date: 20 Sep 16

No Splits history available

No Bonus history available

No Rights history available
Quality key factors
Valuation key factors
Technicals key factors
 Technical Indicator Scale: Bearish, Mildly Bearish, Sideways, Mildly Bullish, Bullish Turned
 Shareholding Snapshot : Mar 2026
Shareholding Compare (%holding)
Promoters
89.6089
Held by 0 Schemes
Held by 0 FIIs
Zee Learn Limited (59.12%)
None
36.55%
Quarterly Results Snapshot (Consolidated) - Mar'26 - YoY

YoY Growth in quarter ended Mar 2026 is -23.41% vs 33.96% in Mar 2025

YoY Growth in quarter ended Mar 2026 is 119.01% vs -31.54% in Mar 2025
Half Yearly Results Snapshot (Consolidated) - Sep'25
Growth in half year ended Sep 2025 is -24.09% vs -5.29% in Sep 2024
Growth in half year ended Sep 2025 is 69.67% vs -22.08% in Sep 2024
Nine Monthly Results Snapshot (Consolidated) - Dec'25
YoY Growth in nine months ended Dec 2025 is -29.92% vs -0.64% in Dec 2024
YoY Growth in nine months ended Dec 2025 is 66.92% vs -0.41% in Dec 2024
Annual Results Snapshot (Consolidated) - Mar'26
YoY Growth in year ended Mar 2026 is -28.24% vs 6.40% in Mar 2025
YoY Growth in year ended Mar 2026 is 89.90% vs -12.08% in Mar 2025
About MT Educare Ltd

Company Coordinates


